Learning how to read Forex charts is key to success whether you are a technical analysis trader or you mainly use the fundamentals.
In this post we look at the important basic principles on how to read the different Forex charts so you can start placing your trades.
NOTE: Your How to Read Forex Charts Beginners Guide Free PDF is Below.
Table of Contents
Three Different Types of Forex Charts
There are three different types of charts that are most commonly used when trading the Forex market.
These are the line, bar and candlestick chart.
Whilst they each have similarities, they have some distinct differences.
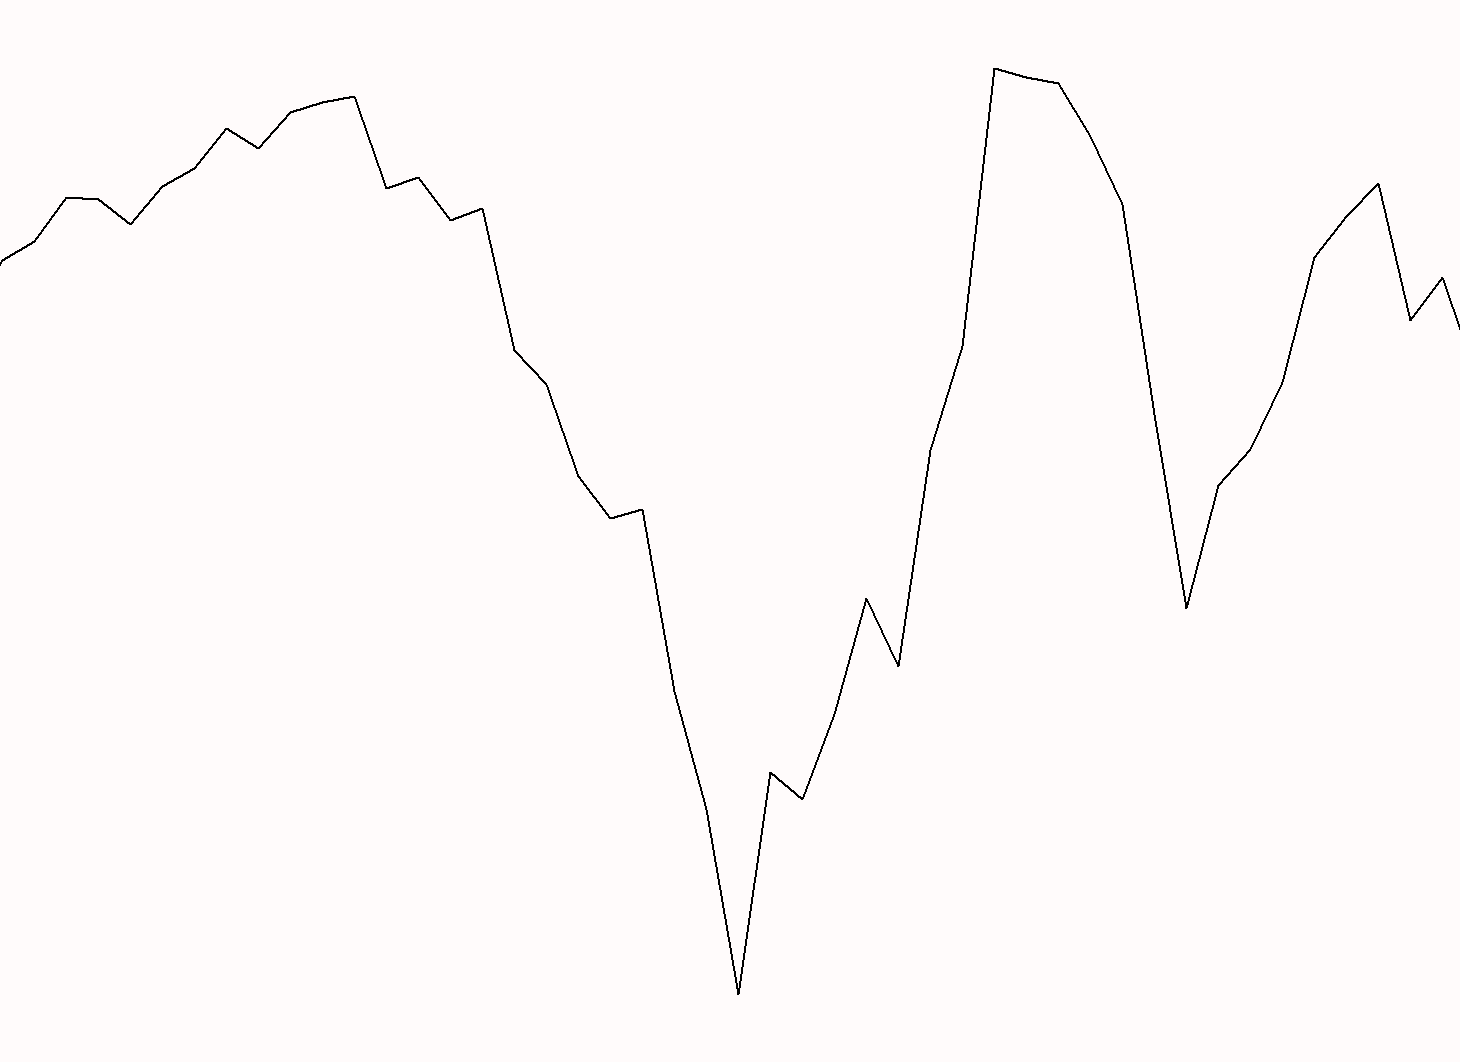
Line Chart
The line chart is the easiest to plot, but also has the least amount of information of the three charts.
The line chart is created by drawing a line from one closing price to another. When price closes again the line is continued to create a continuous line.
This chart does not show more in-depth information such as how high or how low price traded for each session.
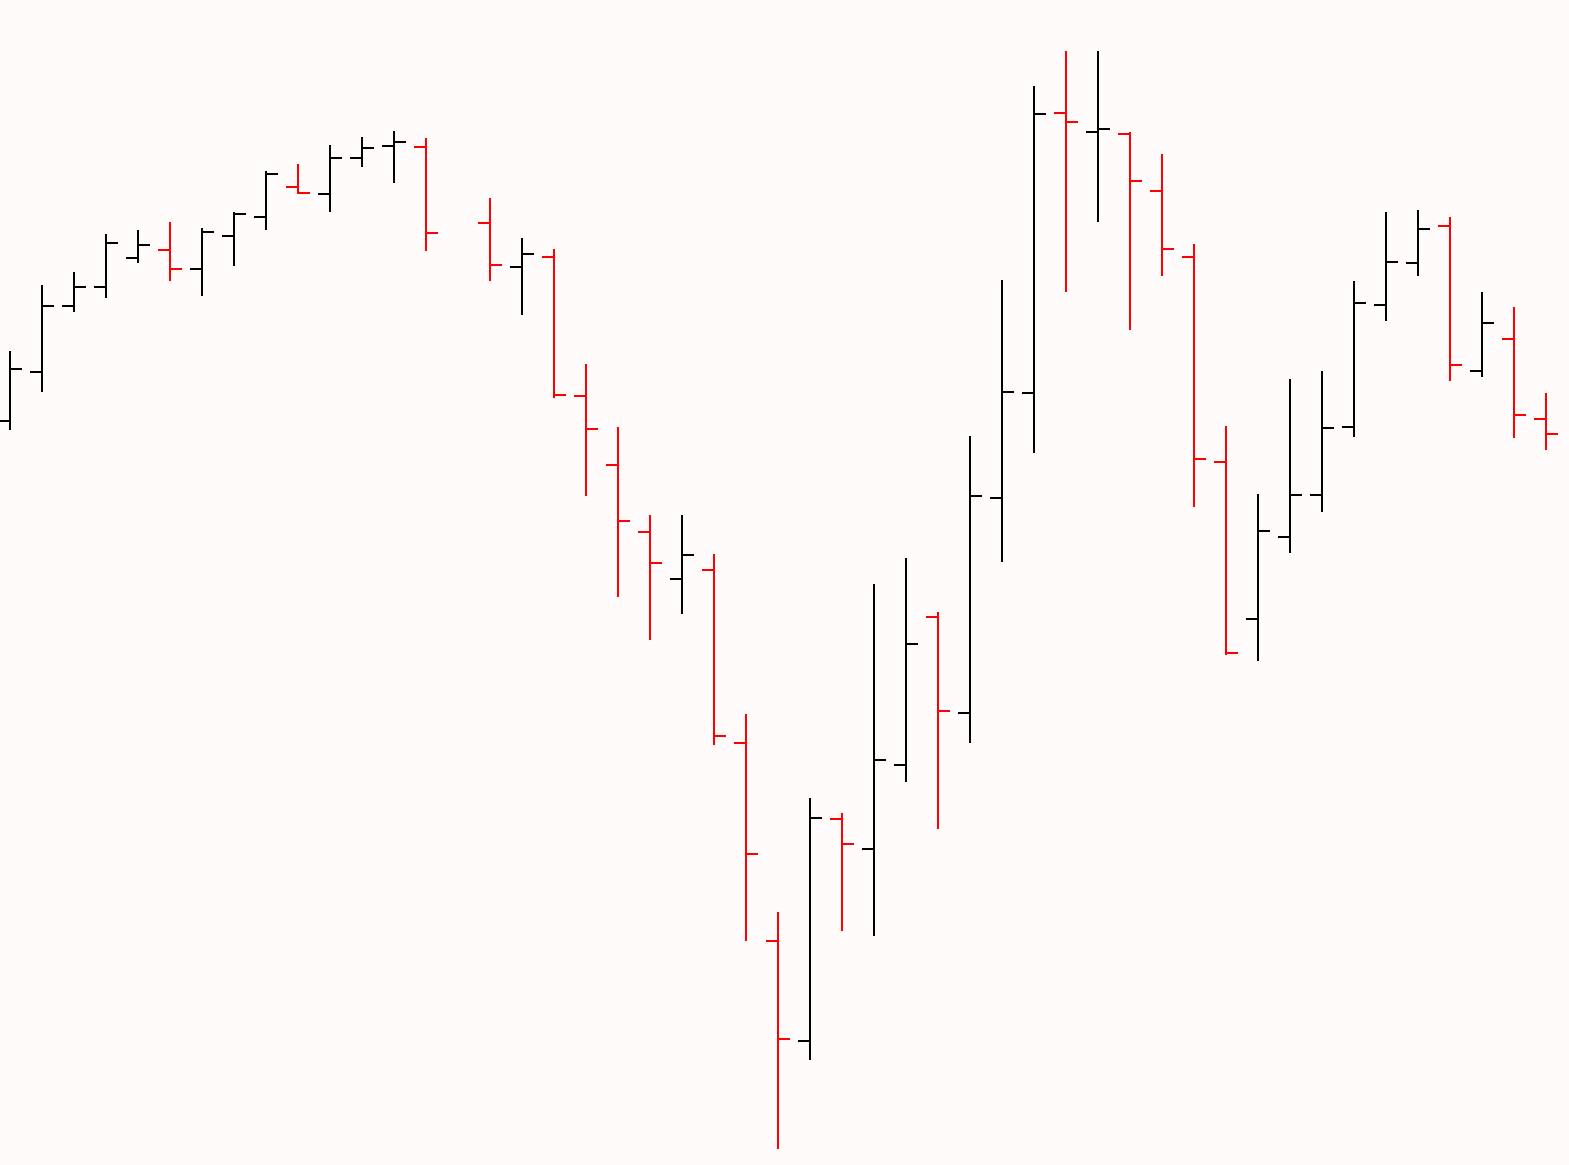
Bar Chart
A bar chart is similar to the candlestick chart and contains more information than the line chart.
With the bar chart you can see the high, low, open and close for each session or time frame you are looking at.
As you can see in the chart below; these ‘bars’ open with the left-wing, then show how far the price moved lower, how far it moved higher before finally showing where it closed.
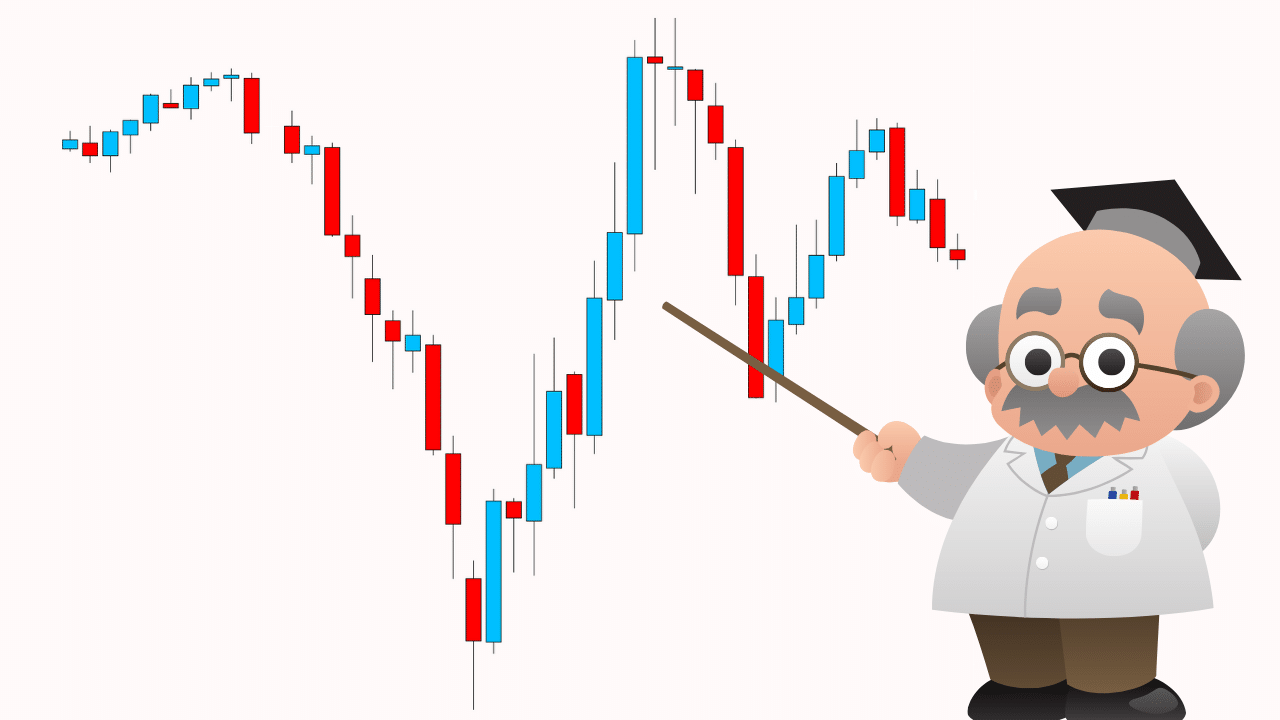
Candlestick Chart
The candlestick chart is the most popular and commonly used Forex chart.
This type of chart is similar to the bar chart, with the main difference being that the candlestick chart has a body.
The candlestick chart shows you the open, low, high and close information just like the bar chart, but as the graph below shows; you will also get the colored body.
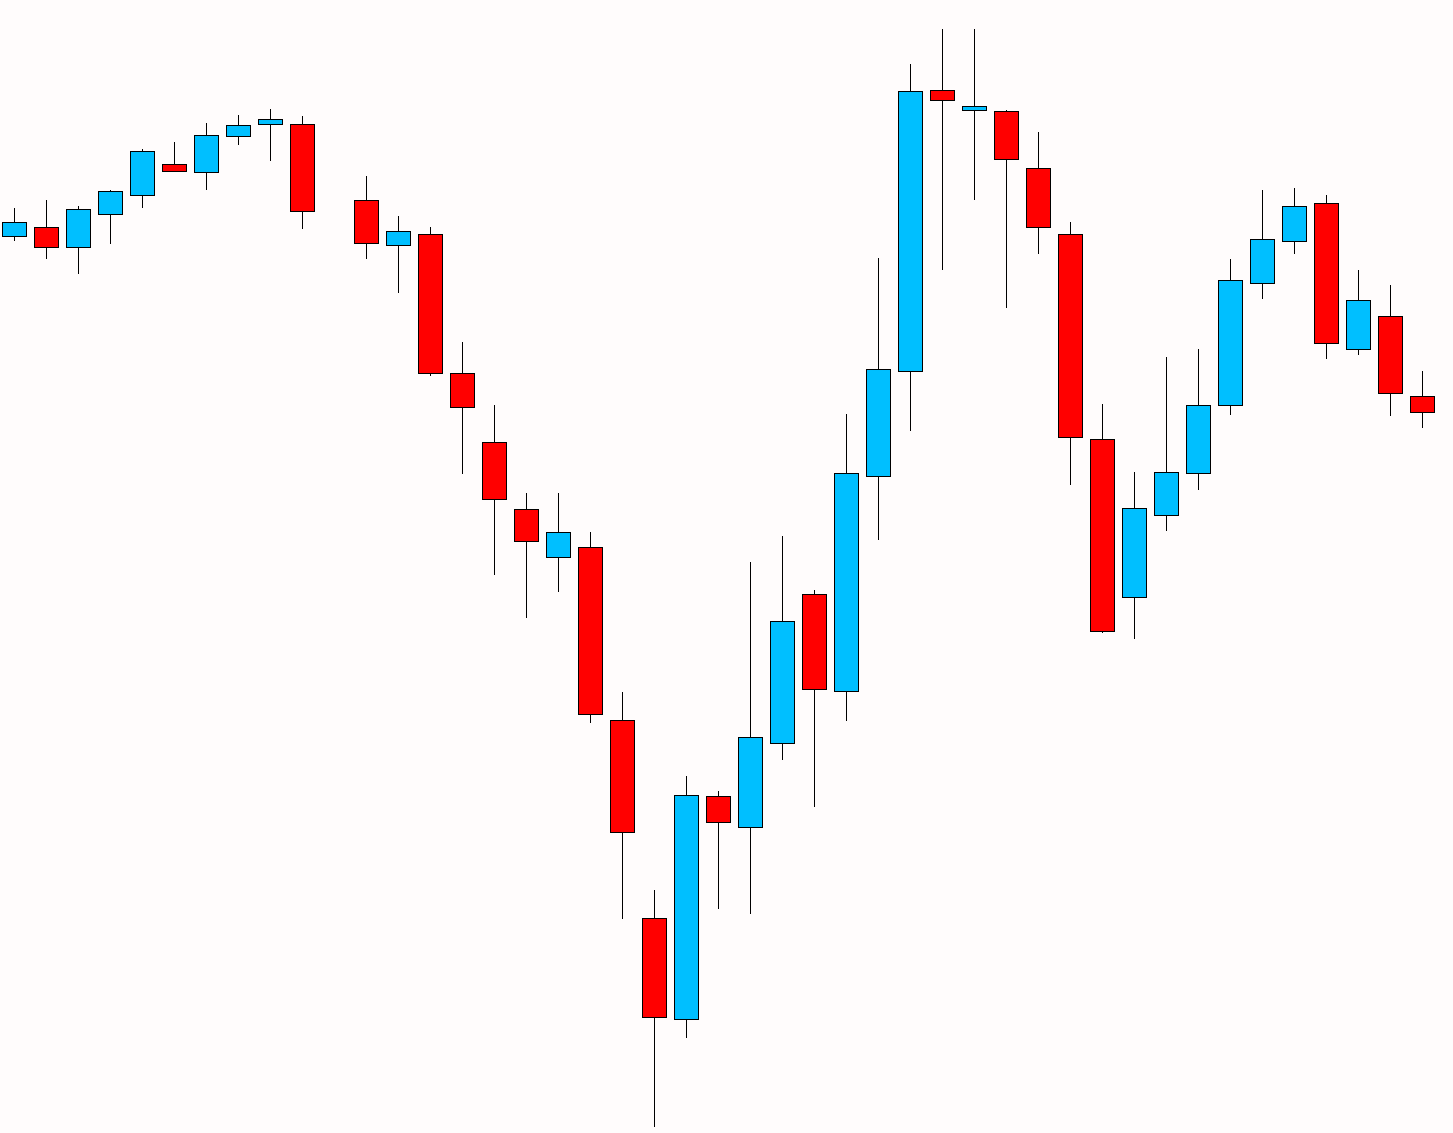
The colored body will help you immediately see whether the price moved higher or lower.
When looking at many candles on a chart you can also quickly get an impression of whether the market is bullish or bearish.
With all three charts you can use them on any time frame you wish.
How to Read the Current Price and Date on Forex Charts
One of the most important parts to being able to read a Forex chart is being able to know what the current price is right now.
Price in the Forex market moves quickly, but luckily you are able to easily see what the current price is.
As the chart shows below; at the bottom of your chart you will see the date.

These dates will move in different increments depending on what time frame you are using. The bigger the time frame, the more spread out the dates will be.
On the right hand side of your chart you will see the current price. The handy thing about this is that when the markets are open it will move up and down showing you the updated price.
How to Read a Currency Quote
Forex is quoted to you with two prices. The price you can buy and the price you can sell.
This is more commonly known as the bid and ask price. Whilst this at first may seem confusing, it really isn’t.
If you are buying a Forex pair you will be paying the ‘Ask’ price. This is the price on the right and you will notice that it will be a little higher than the sell price. This is because your broker will add the spread into this price.
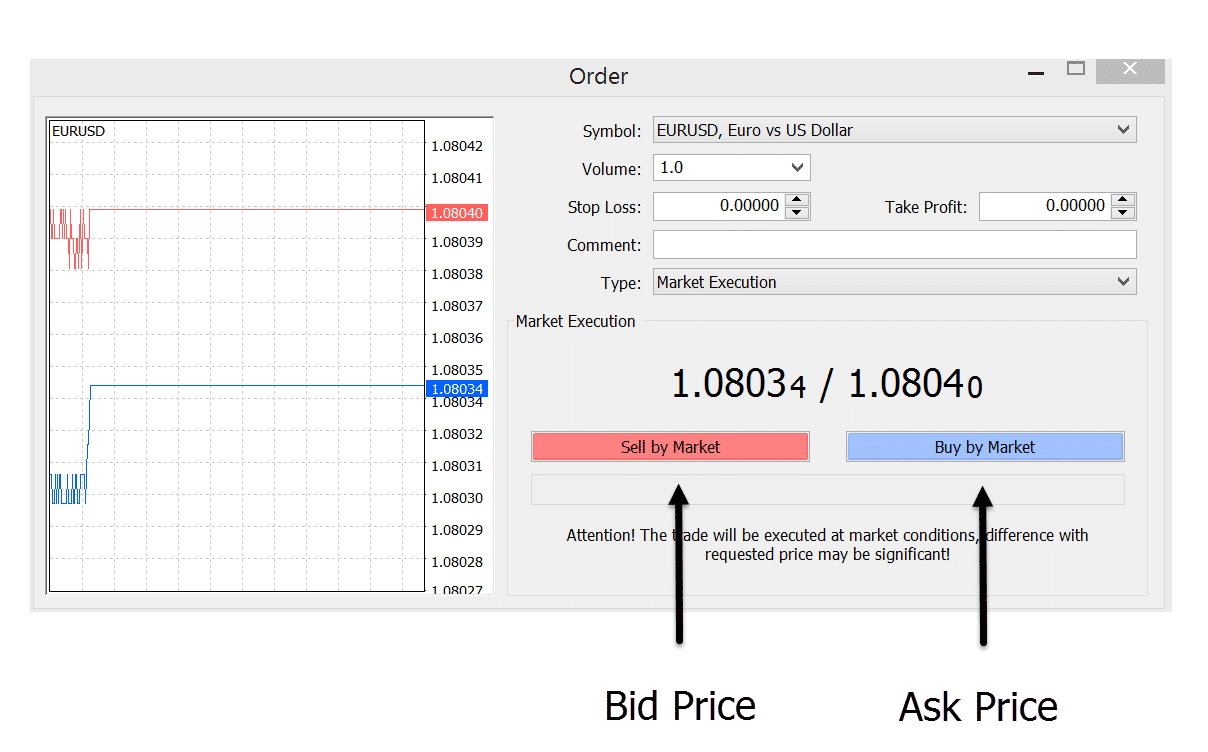
On the left is the ‘Bid’ price. This is the price you can sell at and is the lower of the two prices quoted.
How to Use Different Time Frames
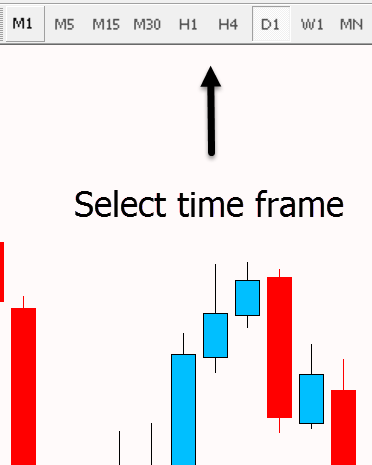
Many traders don’t realize that when they first open up their Forex charts there are many different time frames they can use.
The most common time frames range from the 1 minute through to the monthly time frame with everything such as the daily, 4 hour and 15 minute time frames in between.
The time frame that you should be using depends on the strategy and system you are using and the type of analysis you are implementing.
To use the different time frames simply open your MT4 or MT5 charts and at the top select the time frame you would like to use. See the image below;
Read more about how to use Day Trading Strategies
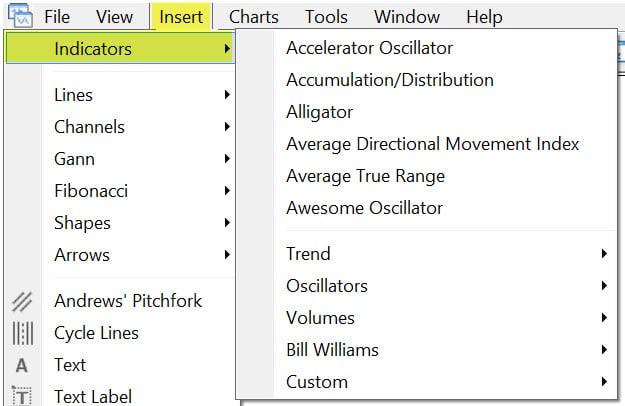
How to Add and Use Indicators on Forex Charts
There are many indicators you can use in your trading to gain an edge over the market.
Whilst there are many great indicators that can help you, often traders will fall into the trap of using too many indicators that inevitably point in the opposite directions to each other. This leads the trader to just end up confused on what they should be doing.
To use indicators on your MT4 and MT5 charts simply;
- Open your MT4 or MT5 charts
- Select “Insert” > “Indicators”
- Select the Indicator you wish to use
Read How to Install and Use MT4 / MT5 Indicators Here
How to Place Orders in MT4 and MT5
To open an order in MT4 or MT5 follow these directions;
- Open your MT4 or MT5 Charts
- Select “Tools” > “New Order”
- When the order box opens choose the Forex pair, how much you would like to trade, the entry type and your take profit and stop loss levels before executing your order.
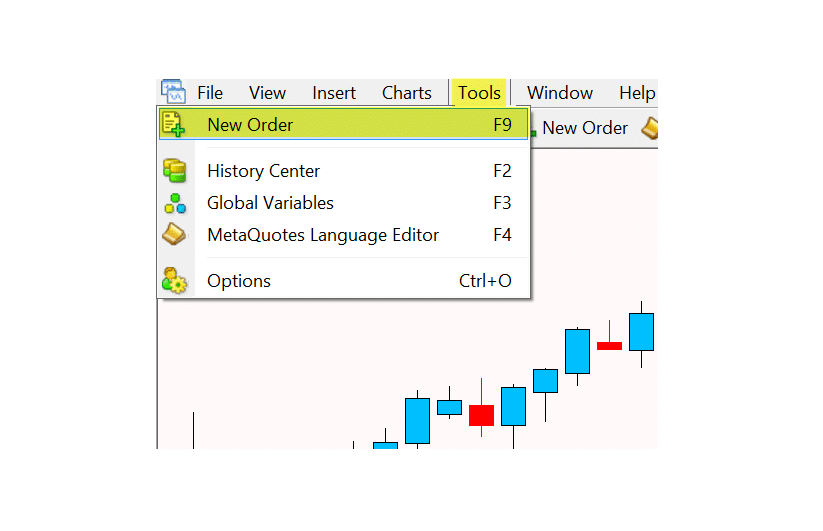
Note: Make sure you use position sizing and correctly work out your potential profit and loss.
How to Get Free MT4 and MT5 Charts
MT4 and MT5 are by far and away the world’s premier charts to trade Forex, stock indices, Gold, Silver, cryptocurrencies and other markets like Oil.
The reason they are so popular is because not only are they lightweight, but they can handle close to anything that is thrown at them.
MT4 and MT5 can be highly customized with indicators and EA’s available that allow you to do pretty much anything with your trading.
You can read about the best MT4 and MT5 charts and how to get them free here.
