The inside bar pattern is one of the most common candlesticks you will find on your charts.
Once you learn how to identify this pattern, then you will very quickly start seeing it everywhere. You will see it in many different markets and on all of your different time frames.
However, just because the inside bar forms often and can be easily identified does not mean you should be using or trading it.
In this post we go through exactly what the inside bar is and how you can use it successfully in your own trading.
Note: You can get your free inside bar trading strategies PDF download below.
Table of Contents
What is the Inside Bar Pattern?
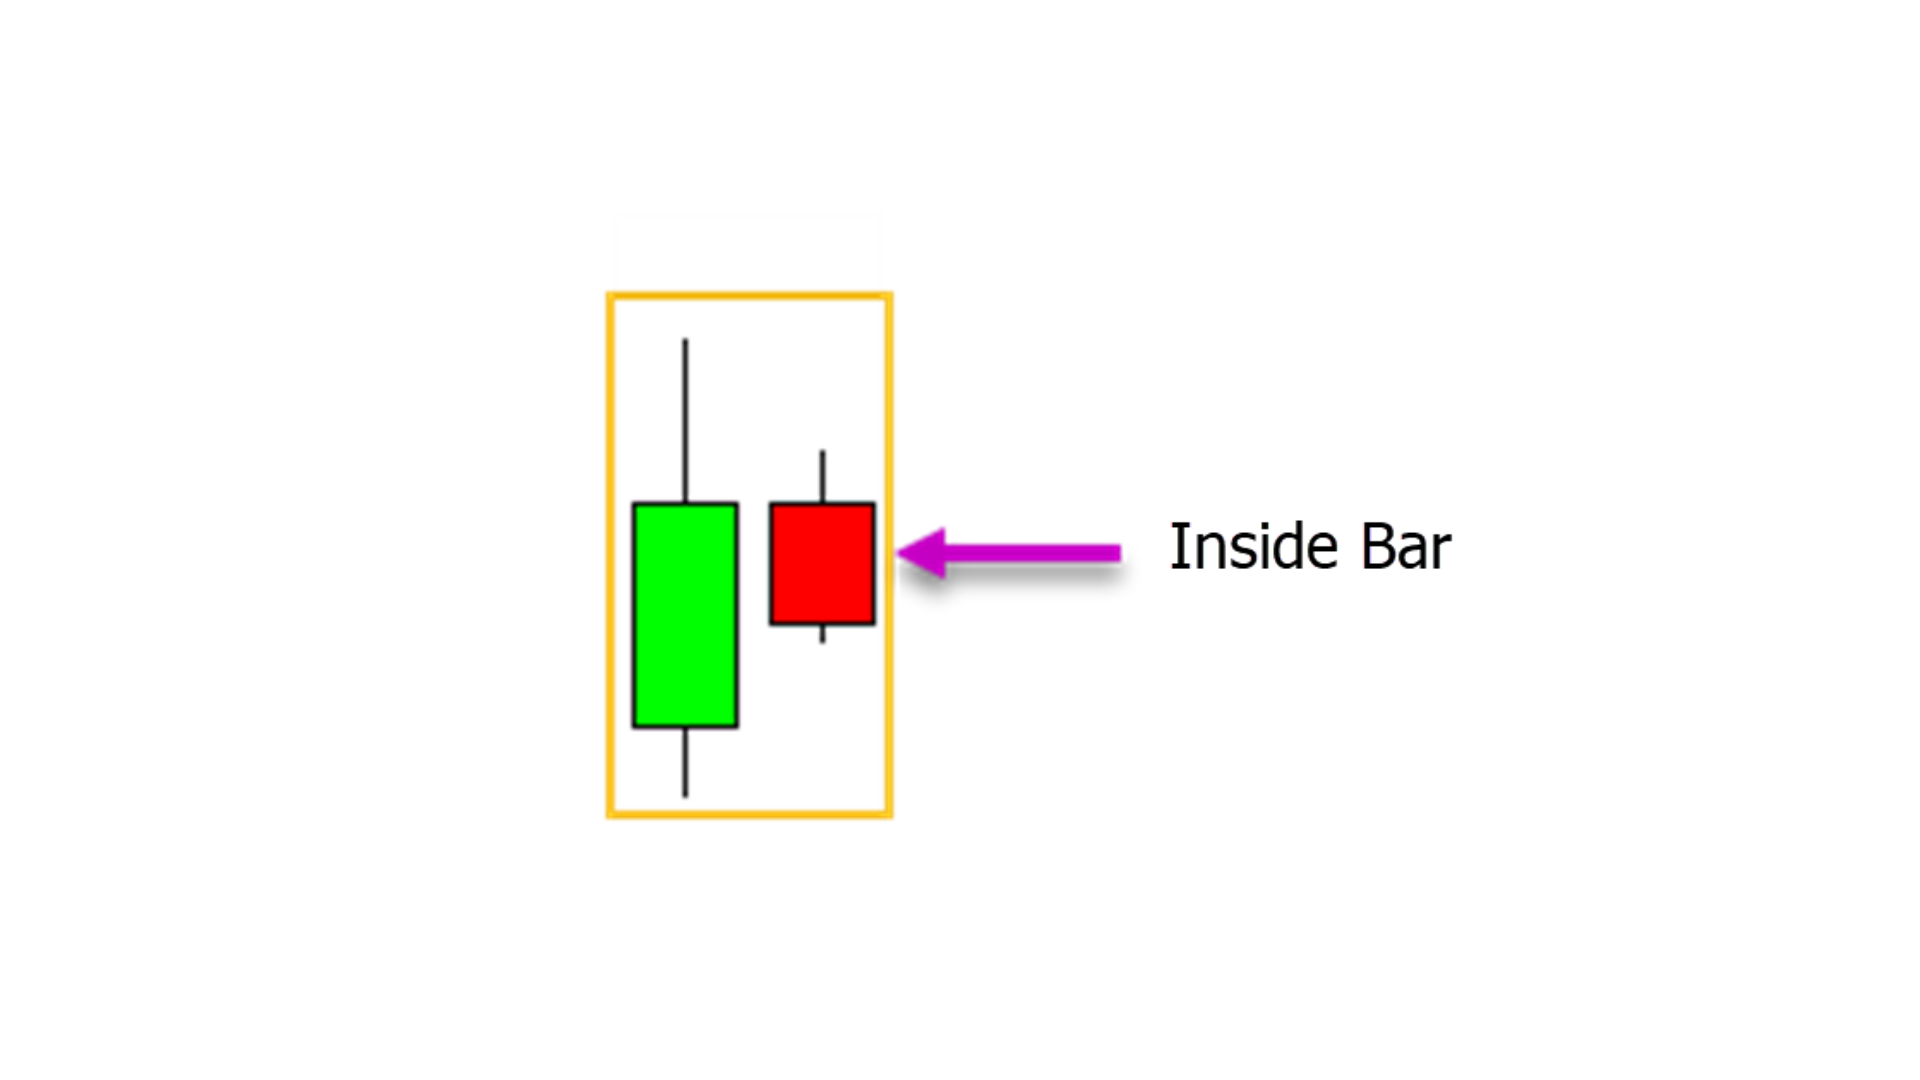
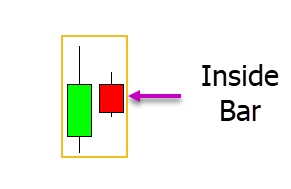
The inside bar pattern is a one candlestick pattern where price forms completely within the previous candlestick.
For an inside bar to be considered valid both the high and the low of the candlestick or bar if using bar charts need to be completely inside the previous candle.
There is often confusion around the wicks or shadows of the candlesticks. To clear this up from the start, the inside bar takes into account the candlestick wicks. This means that the high and low, including the wicks of the candle must be within the high and low of the previous candlestick.
To simplify this even further; the inside bar must have a high that is lower than the previous candlesticks high and a low that is higher than the previous candlestick, including the wicks.
See the example inside bar below.
Is the Inside Bar Bullish or Bearish?
The inside bar is an indecision candlestick pattern.
The inside bar is formed because price was not able to break either the high or the low of the previous session. This shows us that neither the bulls or the bears were in control during the session.
This can be very important information when used correctly, however it is important you note where the inside bar forms and in what type of market.
If an inside bar forms in a strong trend, for example a trend higher, then it could be signalling a quick pause before price continues on with the trend.
If an inside bar forms at a swing point and major support or resistance area, then it could be signalling that the steam has run out of the current move and a reversal is about to play out.
Because this is an indecision candlestick it is very important to pay attention to where and how this pattern forms.
What are the Best Time Frames to Trade the Inside Bar Candle?
You will be able to find this pattern on all of your time frames from the one minute chart right through to the monthly chart.
However, just because you can find the inside bar on all of your time frames does not make them all created equal.
Inside bars formed on higher time frames will hold more weight compared to inside bars formed on smaller time frames.
The reason for this is because of the time that goes into forming the pattern.
If price action is showing indecision and cannot break the previous candlestick high or low on the one minute time frame, that shows us that for one minute price was stuck.
However, if we see that price could not break higher or lower on the daily time frame and forms an inside bar, then it shows that for a whole day neither the bulls or bears could gain control.
Inside Bar Candlestick Trading Strategies
There are many ways you can use the inside bar in your trading. You can use it to find new trades and you can also use it to manage your trades. You can also use it as a trailing stop loss strategy.
The two simplest and most common strategies to trade the inside bar are the inside bar breakout and the inside bar reversal strategy.
Trading the Inside Bar as a Breakout
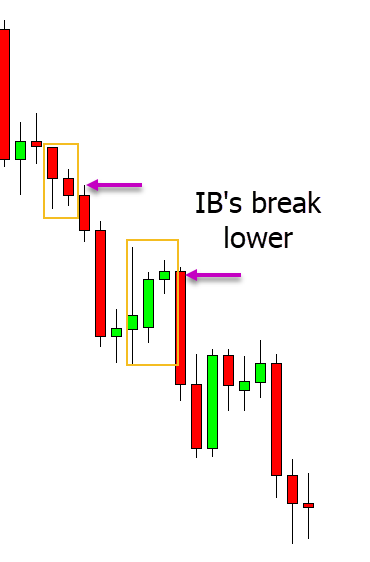
The first key to trade the inside bar as a breakout strategy is identifying a strong trend either higher or lower.
In the example below, price is in a strong trend lower. Because there is a strong trend, the inside bar represents a pause in the price action where some profit is being taken and price is taking a breather.
When looking to enter with the inside bar breakout you are looking to enter when the signal confirms itself. This happens when price breaks the inside bar high or low in the direction of the trend. In the example below we are looking to take a short entry when the signal confirms itself and breaks lower with the trend.
Trading the Inside Bar as a Reversal
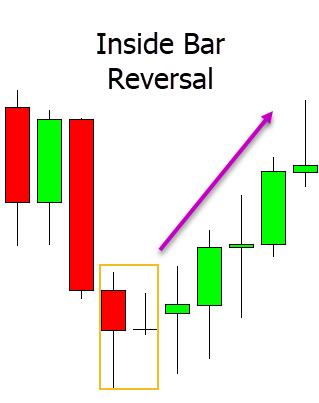
The key to the inside bar reversal strategy is where the inside bar forms.
To use the inside bar as a reversal you need to see it formed at swing highs or lows and at key price action levels. These levels are often major support or resistance levels.
In the example below price moves lower into a swing low and forms an inside bar. If this inside bar was formed at support, then it could be an indication that price is looking to make a reversal back higher and we could look to get long when price breaks back above the inside bar high.
Lastly
Whilst you will find the inside bar on all of your different time frames, the higher the time frame the more weight the pattern holds.
Because this is an indecision candlestick pattern it is absolutely crucial where and how it forms. You need to look at and follow the price action that is formed around the inside bar to successfully start using them.
The best thing you can do to start testing out the inside bar trading strategy is to download a set of free virtual / demo trading charts and test out different methods with virtual money first before you ever risk any real money in the live market.
Note: You can get your free inside bar trading strategies PDF download below.
