A trading indicator is simply a mathematical calculation designed to assist technical analysts in their trading.
Technical analysts use these indicators to gain an insight into the future price action of securities that are being traded on the public markets.
Analysts use these mathematical calculations to analyze various metrics such as trading volume and historical price data to predict where the price of a security will go in the future and adjust their trades accordingly.
This post will briefly explore one specific indicator known as the Chaikin Money Flow indicator.
NOTE: Want a full list of some of the best free MT4 and MT5 indicators you can use in your trading? You can get them below.
Table of Contents
What is the Chaikin Money Flow Indicator?
To understand this indicator, you must first understand the concept of “Money Flow”.
Money Flow is a metric that technical analysts use to inform their trading.
It is calculated by averaging the high, low, and closing prices, then multiplying by the daily volume. When the result of this calculation is compared to previous days’ results, it details whether or not the money flow is positive or negative for that specific trading day. If the money flow is positive, it indicates that prices are likely to move upward.
If the money flow is negative, it indicates that prices may fall. As you might imagine, knowing which direction prices are likely to go is a useful bit of information for traders to have. As a result, indicators were developed to track this metric and help forecast future price movements.
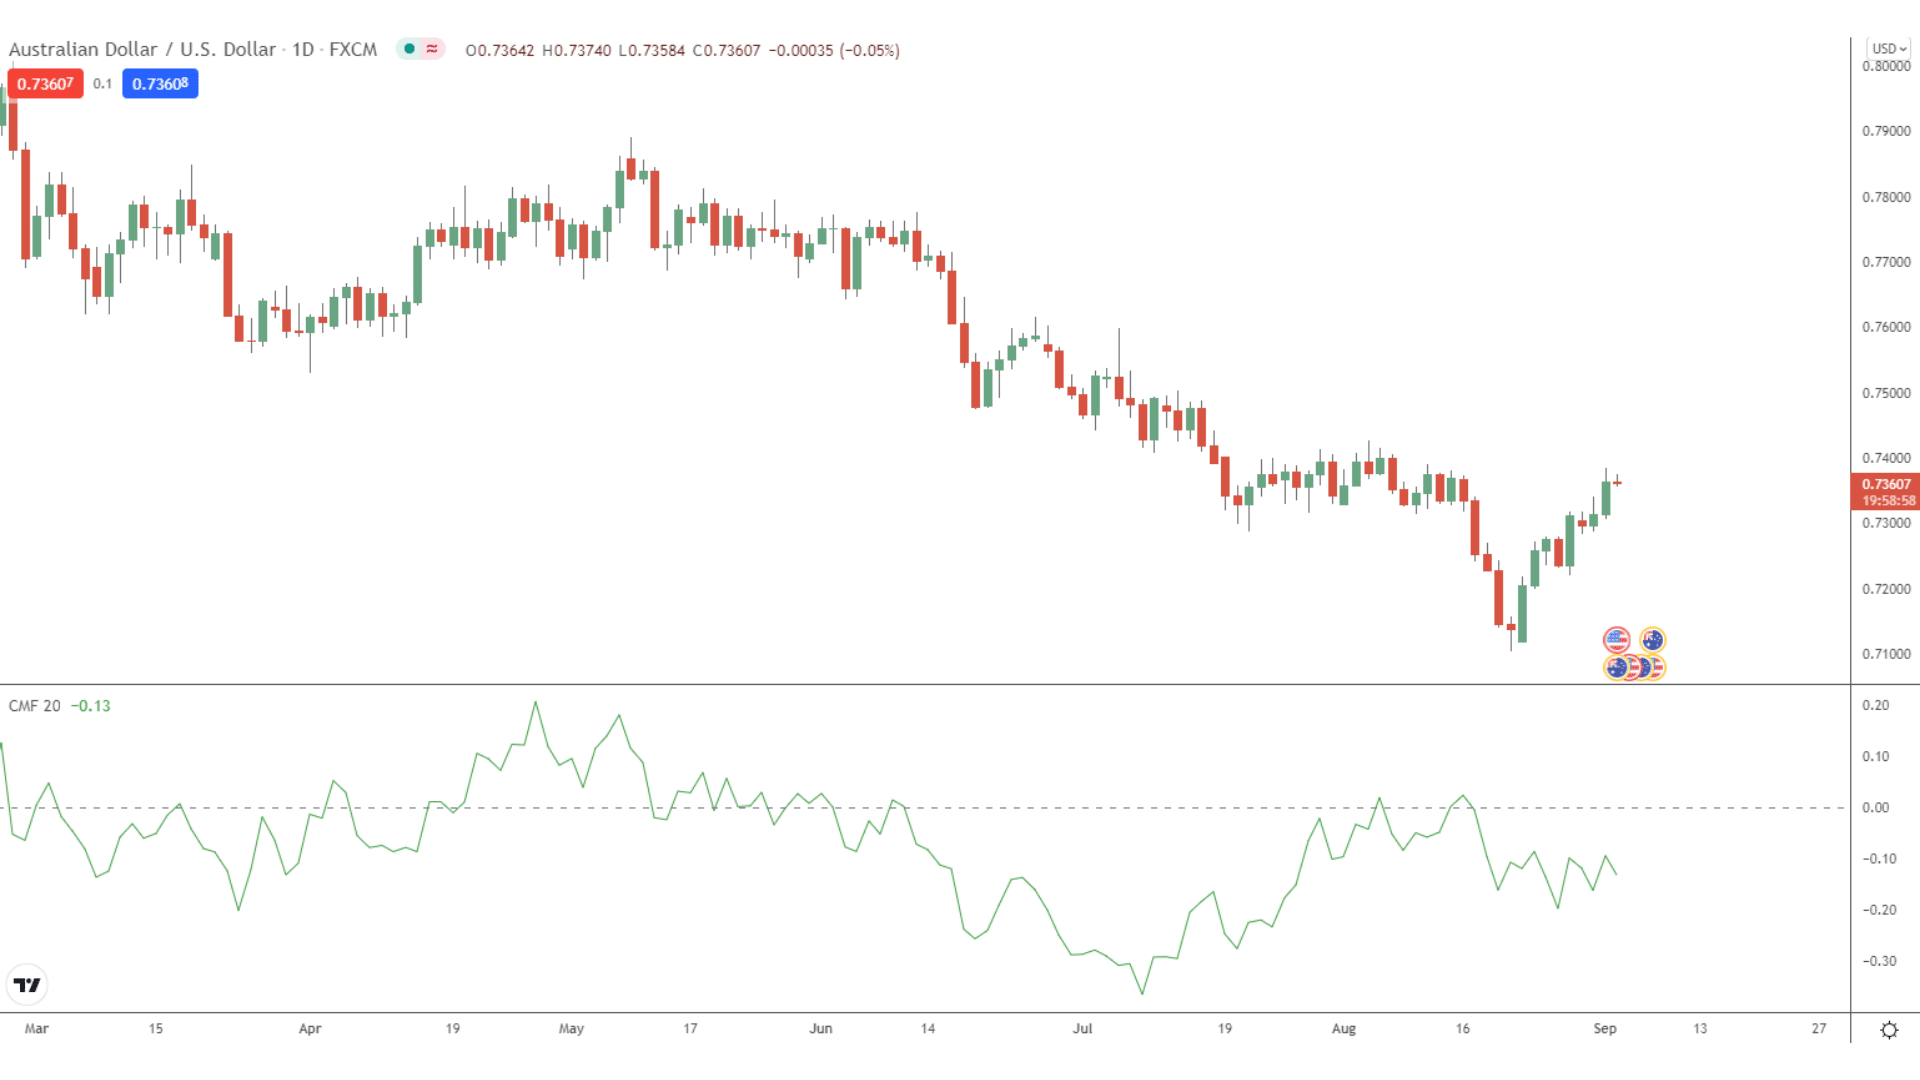
Developed by Marc Chaikin in the early 1980s, the Chaikin Money Flow indicator is a volume-weighted average of accumulation and distribution over a specific period.
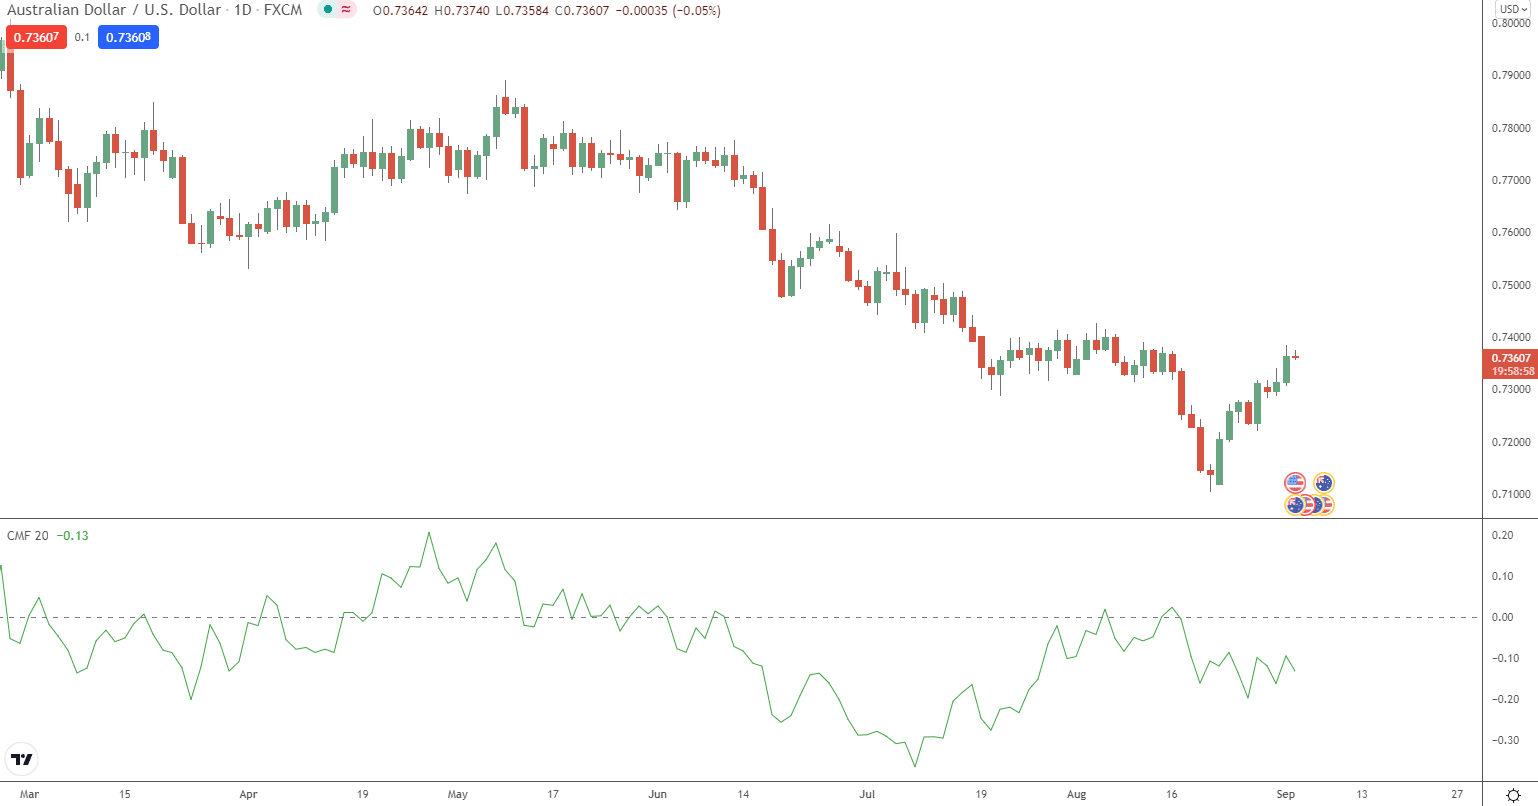
Mr. Chaikin believed that buying and selling pressure could be targeted by analyzing where a period closes in relation to its high/low range. In light of this, he developed an indicator that measures the Money Flow Volume over a set period of time.
The indicator is based on the principle that the closer the closing price is to a high, the more accumulation has occurred in that security. Similarly, the closer the closing price is to a low, the more distribution has occurred in that security. This particular indicator operates between 1 and -1.
Generally, when the indicator is closer to 1, this indicates that the buying pressure is higher. When the indicator is closer to -1, this indicates that selling pressure is higher. Whilst the typical period of time for Chaikin money flow is approximately 21 days, the individual trader can set any range.
However, the indicator will be more reliable over longer time frames, and the 21-day range will likely provide the most reliable data.
How to Use the Chaikin Money Flow Indicator
You now know that a Chaikin Money Flow indicator with a reading above 1 indicates strength in the market and that a reading below 1 indicates weakness.
The next step to successfully using this indicator will be to wait for a breakout in the price of a security.
Once a breakout takes place, you need to wait for the breakout to be confirmed. You can do this by examining technical indicators such as trend lines or support and resistance lines.
For example, if the price falls below a support line and the Chaikin Money Flow indicator has a reading below 1, the breakout is confirmed. In this example, you would consider entering a short position as it is probable that the stock will begin trending downward.
This indicator will also provide you with buy/sell signals. The indicator will signal to sell when price action attains a higher high inside overbought zones, with the indicator diverging to a lower high and beginning to fall.
A signal to buy will present when the price action develops a lower low into oversold zones, with the indicator diverging to a higher low and beginning to rise.
As we detailed above, the Chaikin Money Flow indicator will be more reliable over longer time frames.
If you use the indicator over a shorter time frame, you should confirm your conclusions by examining other indicators such as the Relative Strength Index (RSI) and Moving Average Convergence Indicator (MACD).
Chaikin Money Flow Divergence
A divergence occurs when a price move is not accompanied by a similar change in the Money Flow.
A negative money flow divergence can be an important indicator of potential short-term risk or help identify potential securities to short when selecting from a series of bearish securities.
This is especially true when the divergence is combined with a Chaikin sell signal, such as an overbought sell.
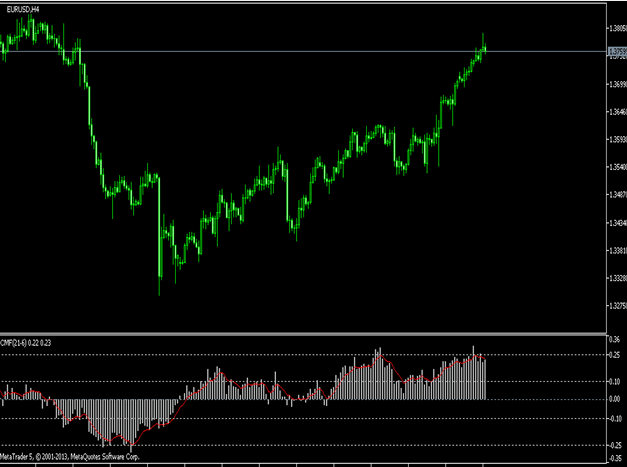
Under normal circumstances, Money Flow should correspond with price movement over the same period of time. As the price rises, the money flow should become greener, and as the closing price falls, the money flow change to red.
The price movement is confirmed if a security experiences a short-lived price increase whilst money flow stays positive.
However, if the same security experiences a short-lived rally from the lower end of the Chaikin band to the upper levels of the Chaikin band, and Money Flow remains significantly red, this indicates a pullback in the price of this security is likely to occur.
Chaikin Money Flow Indicator for MT4
The Chaikin indicator, like most indicators, is freely available to anyone with access to the internet. MT4 is an online trading platform widely used by traders who trade in foreign exchange markets.
Unfortunately, the Chaikin Money Flow indicator does not come built into MT4, but you can download it from the link below.
Get the Chaikin money flow indicator for MT4 here.
Chaikin Money Flow Indicator for MT5
Like MT4, MT5 is also an online trading platform. Unlike MT4, MT5 has access to a wider range of assets to trade, including stocks, forex, and futures. Thankfully, the indicator is much easier to access on MT5. Note that this MT5 Chaikin money flow indicator is a premium indicator and is not free.
Get the Chaikin Money Flow Indicator for MT5 here.
Alternatively, the indicator is available for free at www.tradingview.com. You can find it by selecting Chart > Indicators > Search > Chaikin Money Flow.
Note: Don’t know how to install and use these indicators? Read How to Download, Install and Use MT4 and MT5 Indicators.
Lastly
It is vital to remember that indicators only provide you with an insight into probable outcomes and that no indicator can reliably predict the future every single time.
Ultimately, indicators are only as useful as the interpretations of the trader reading them.
To ensure that your conclusions are as well thought out as possible, you should test your theory against other indicators before deciding. No single indicator should be used to inform your trading decisions.
