Renko charts are a popular type of chart for many traders because they filter out the price action noise and show a very simple picture.
With Renko charts the small price fluctuations are removed which leaves a simplified chart. This can help you quickly and easily spot obvious trends and areas of important support or resistance.
In this post we go through exactly what Renko charts are, how to use them and how to use them in your MT4 and MT5 charts with a free indicator.
NOTE: Want a full list of some of the best free MT4 and MT5 indicators you can use in your trading? You can get them below.
What are Renko Charts?
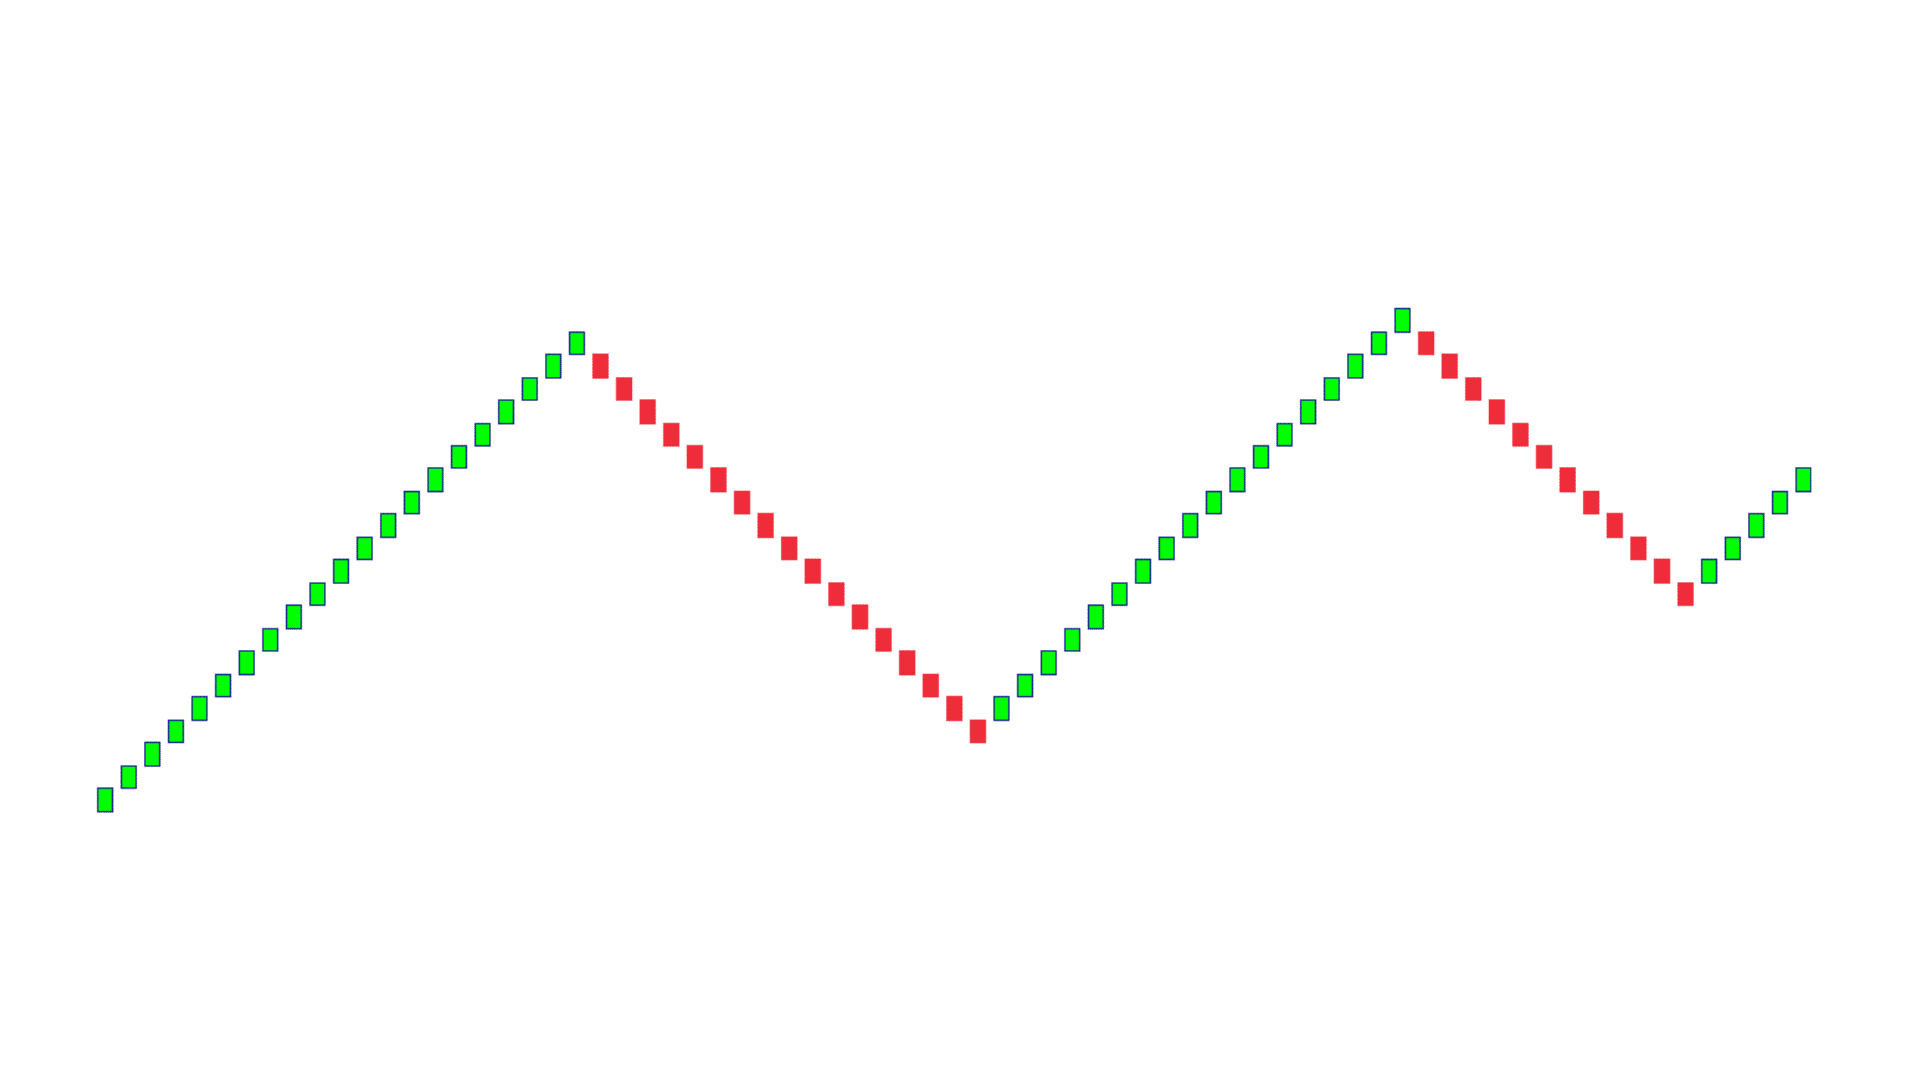
Renko charts show up on your chart in the form of a brick. This is sometimes also called a box or block.
The difference between candlestick charts and Renko charts is the information they show and how they are formed. Where a candlestick chart will show you the open, high, low and close of each session, the Renko chart is very different.
The Renko chart forms bricks depending on your settings.
A brick on a Renko chart will only form once price has moved a certain distance. For example; if you have put into the settings that price must move 20 pips before creating a brick, then the Renko chart will not form a new brick until price has moved 20 pips.
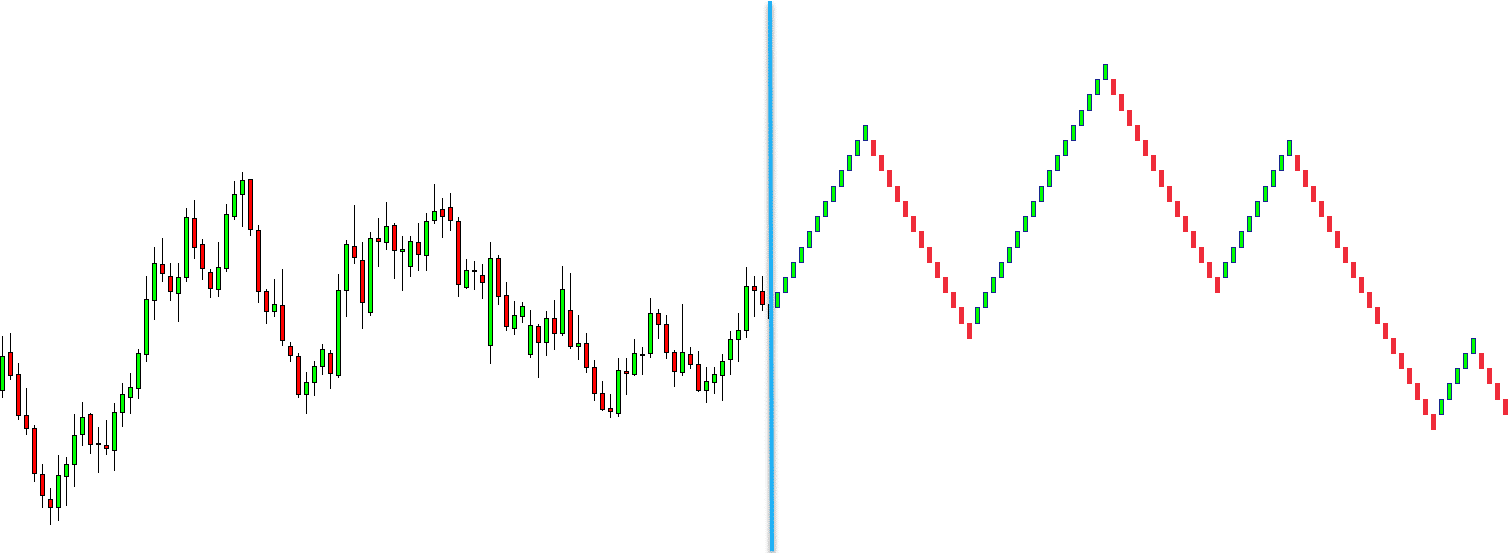
See the example below on just how different candlestick and Renko charts are.
Where the candlestick charts are moving higher and lower, the Renko chart is much more smoothed showing you a much clearer picture of the trend.
Renko Chart Disadvantages
Whilst the Renko chart can quickly show you the current trend or important support and resistance levels, there are some disadvantages.
The Renko chart does not give you all of the price action picture and everything that price has done.
For many trading strategies knowing how high and low price has traded and where it has closed is crucial.
Because you are waiting for price to meet a certain requirement before forming a new brick on the Renko chart you do not get this information.
The Renko chart can be great at smoothing out the overall price action picture, but if you are looking for the full in-depth price action story you might need to use it in conjunction with the candlestick chart.
Renko Chart Patterns
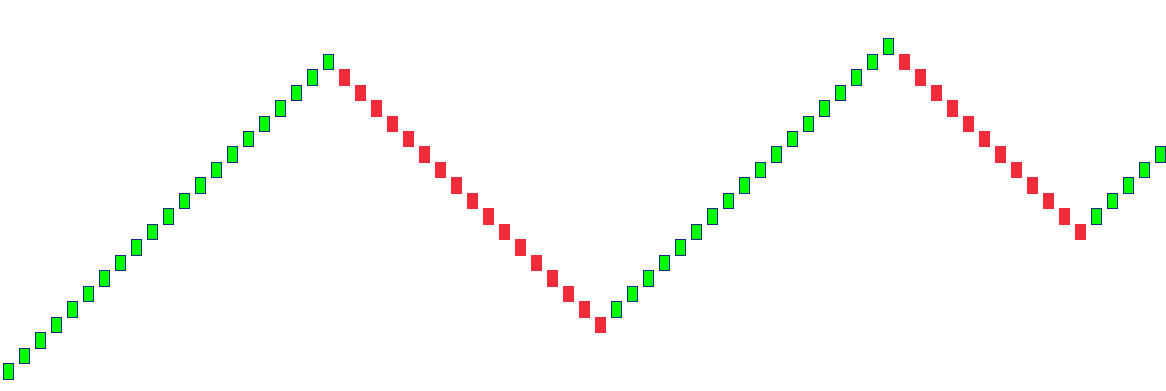
The best patterns when trading with Renko charts are support and resistance, trends and breakouts.
Because the Renko chart is so simple and it smooths everything out it can quickly help you identify the current trend and momentum.
You can also use it to find where price is respecting the same supply and demand zones allowing you to find high probability trades.
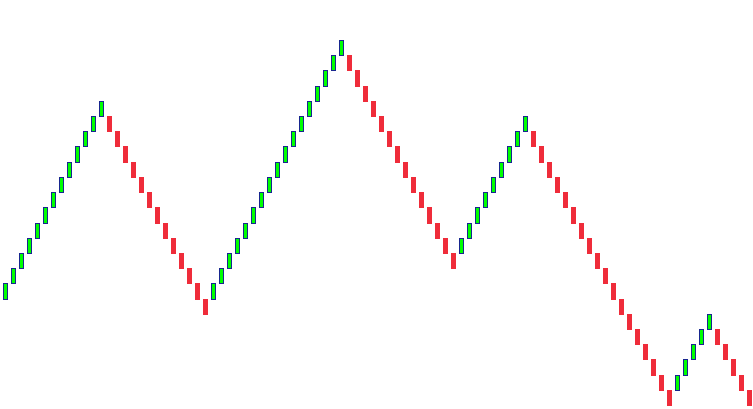
The chart example below shows the trend, support and resistance and also a head and shoulders pattern in play.
With the head and shoulders pattern you will see the left shoulder, the head in the middle and the right shoulder just before price collapses and moves lower to complete the pattern.