The TRIX indicator is a simple and easy-to-use indicator that can help you find buy and sell signals.
This post goes through precisely what the TRIX indicator is, how to use it and how to use it in your MT4 and MT5 charts.
NOTE: Want a full list of some of the best free MT4 and MT5 indicators you can use in your trading? You can get them below.
Table of Contents
What is the TRIX Indicator
TRIX is short for ‘triple exponential average’ and is an indicator that tracks momentum.
Many technical analysis traders use the TRIX indicator because it can help them identify overbought and oversold market conditions.
The TRIX indicator shows the change in a moving average that has been smoothed out exponentially three times.
The reason for the triple smoothing of the moving averages is that it can help you filter out false moves or moves that are not significant.
How to Use a TRIX Indicator
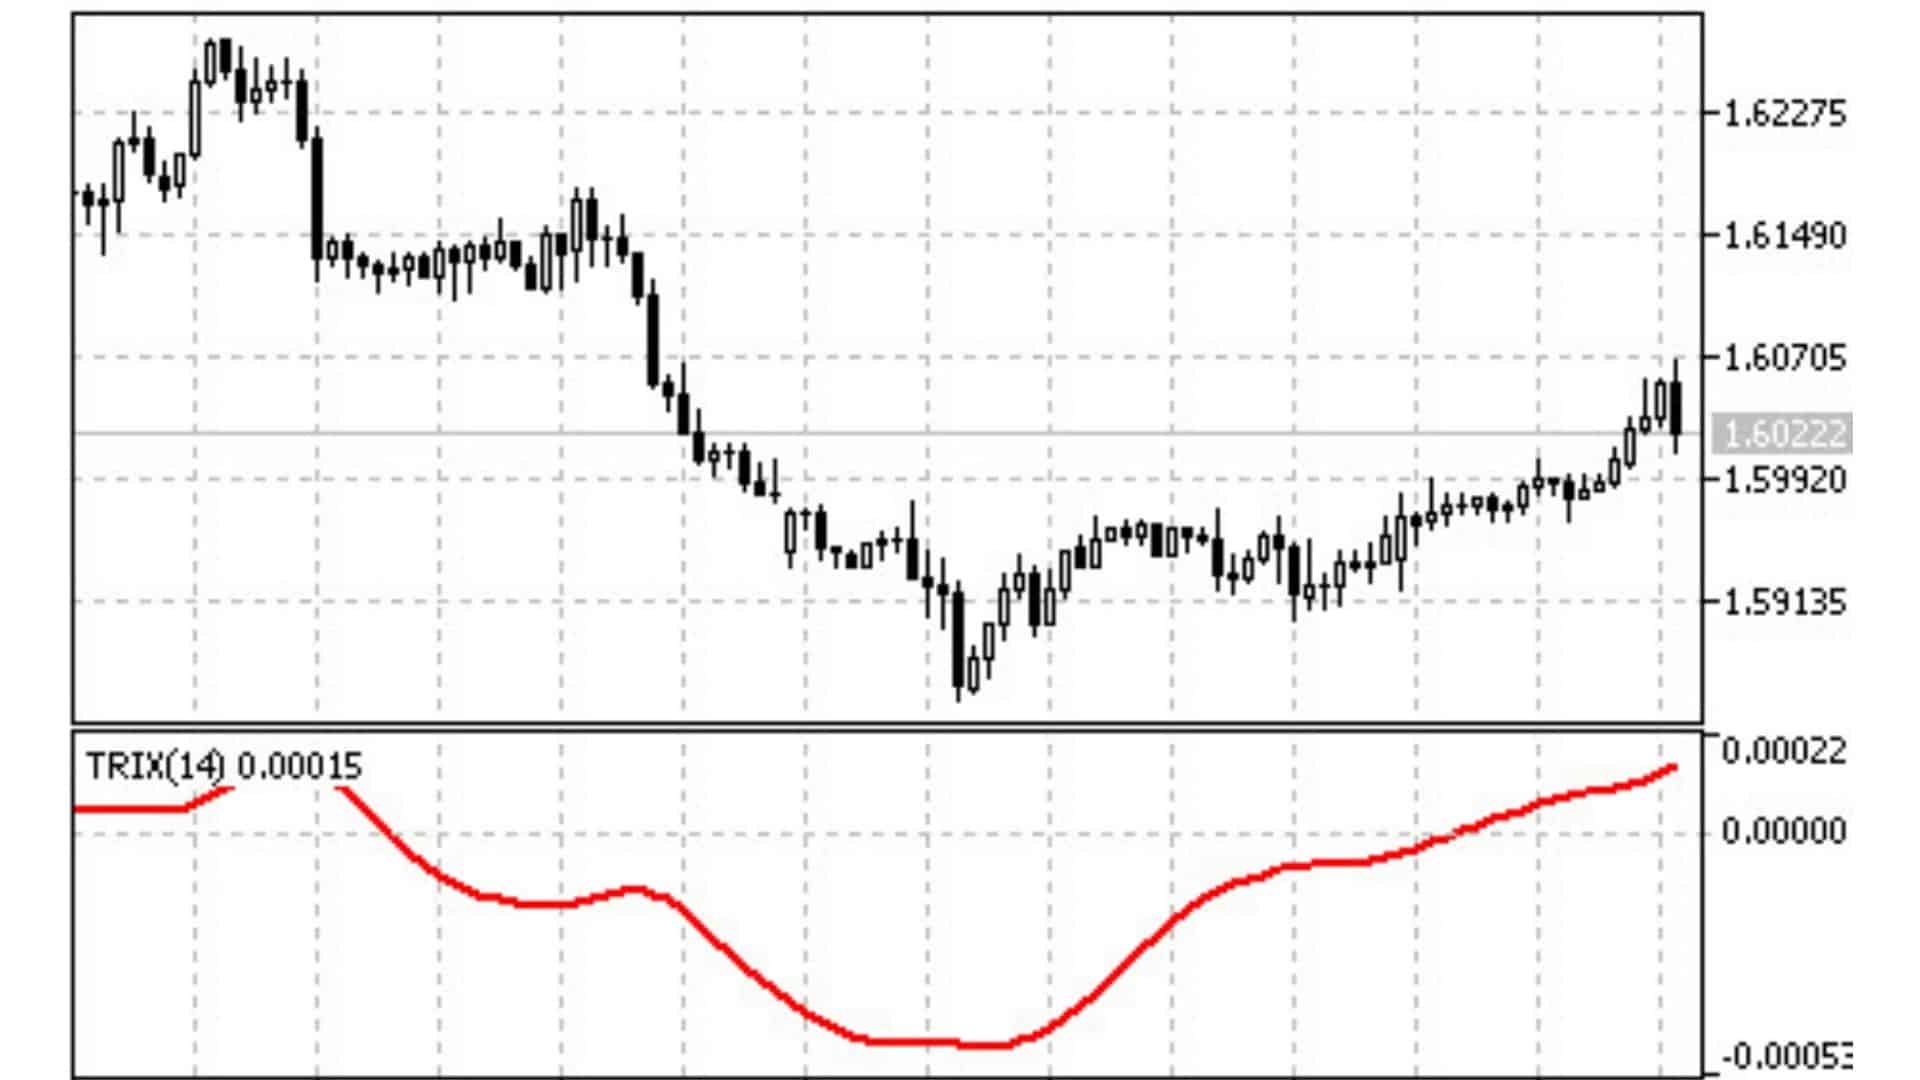
The TRIX indicator operates as an oscillator on your chart.
Many traders believe that when the TRIX crosses above the zero level, it acts as a buy signal.
Conversely, when price moves below the zero level, it acts as a sell signal.
You can also use this information to find divergences and potential reversal points.
The TRIX indicator can be used on all of your time frames and any market you like making it a handy indicator for creating and managing your trades.
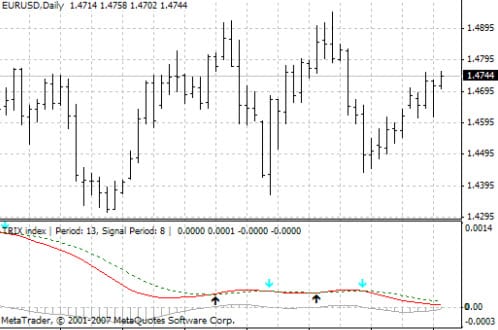
TRIX Indicator for MT4
This TRIX indicator for MT4 can quickly and easily help you identify overbought and oversold conditions.
This indicator can be used as an impulse indicator or to find divergence.
This TRIX indicator is an oscillator that moves above and below zero. When the TRIX moves above the zero line, it can be interpreted as a buy signal. On the other hand, it can be seen as a sell signal when it moves below the zero level.
If looking to use this TRIX indicator to spot divergence and potential market reversal, you can see if there is a divergence between the price and the indicators line.
You can get your TRIX indicator for MT4 here.
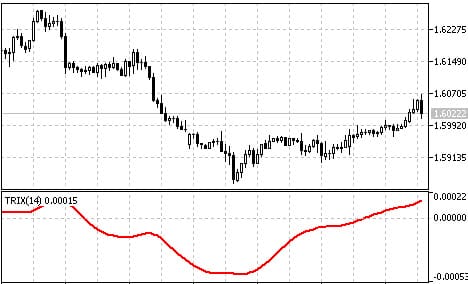
TRIX Indicator for MT5
This TRIX indicator for MT5 is based on the indicator that Jack Hutson created.
When using this indicator in your MT5 charts, you will be able to quickly and easily identify overbought and oversold market conditions.
This indicator can be a momentum indicator or an indicator to help you find divergence.
Technical analysis traders will use this indicator by looking at the zero level.
When the indicator moves above the zero level, it is usually seen as a buy signal.
On the other hand, when the indicator moves below the zero level, it is usually seen as a sell signal.
To find divergence, you look at the difference between what price is doing and what the indicator is doing.
You can get your TRIX indicator for MT5 here.
Lastly
The TRIX indicator is a straightforward indicator that can quickly help you find when the market is overbought or oversold. It can also help you find divergence by looking at what price is doing in relation to the indicator.
As with any new strategy or indicator, it is always best to test it out on a free demo account, risking only paper money before you start risking real money.
