All markets such as Forex, crypto, and stocks need trading volume to move higher or lower.
Being able to read and analyze volume in your trading accurately can help you find high probability trades.
This post looks at exactly what volume is and how you can use it in your trading with different strategies.
NOTE: You can get your free volume trading strategies PDF guide below.
Table of Contents
What is Volume When Trading?
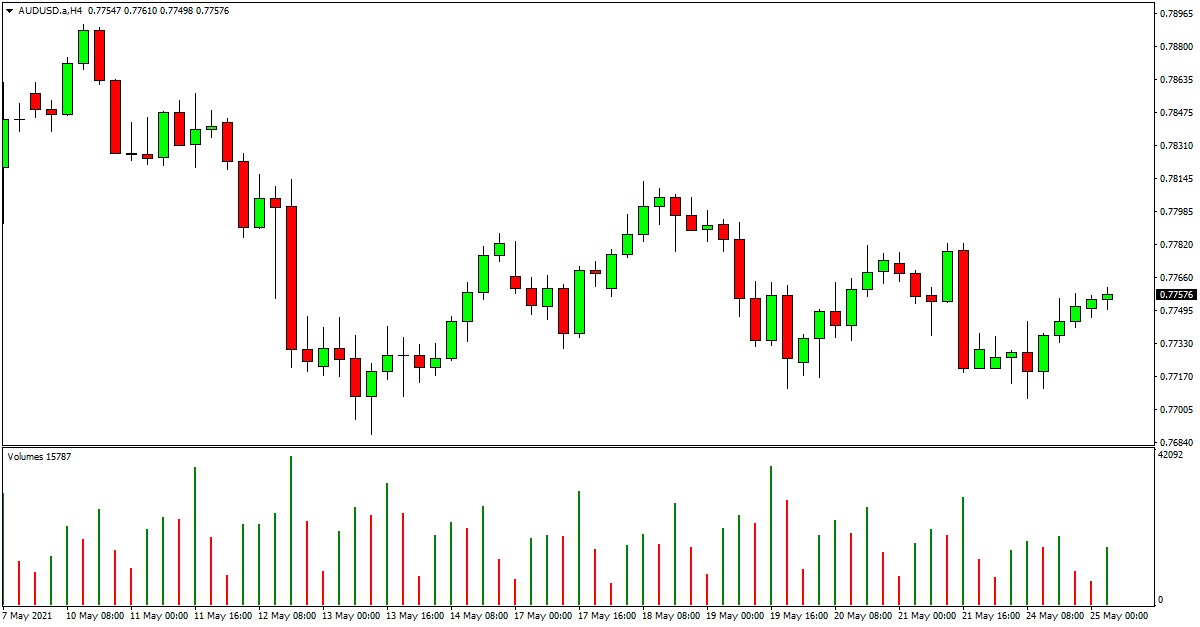
At its simplest, volume is the amount that has been traded for a certain market over a certain time frame.
Volume can be handy when looking to find and manage your trades because knowing when the volume is spiking or backing off can help you analyze what the market is doing.
Volume information can help you find new potential moves, breakouts, and even when to look for a potential fakeout.
Markets like stocks have a centralized system that can help you accurately read the different volume levels.
Markets such as Forex, however, are now centralized. The volume information you get will be slightly different for each broker. This is because each broker is using different liquidity providers to fill their orders.
With that said, you can still get a pretty good idea of volume and in particular, volume spikes when using a few main indicators.
List of Volume Indicators
There are a range of different indicators that will help you analyze volume levels, but four of the most popular volume indicators include;
#1: VWAP
#2: On Balance Volume
#3: Chaikin Money Flow (CMF)
#4: Volume Price Trend Indicator (VPT)
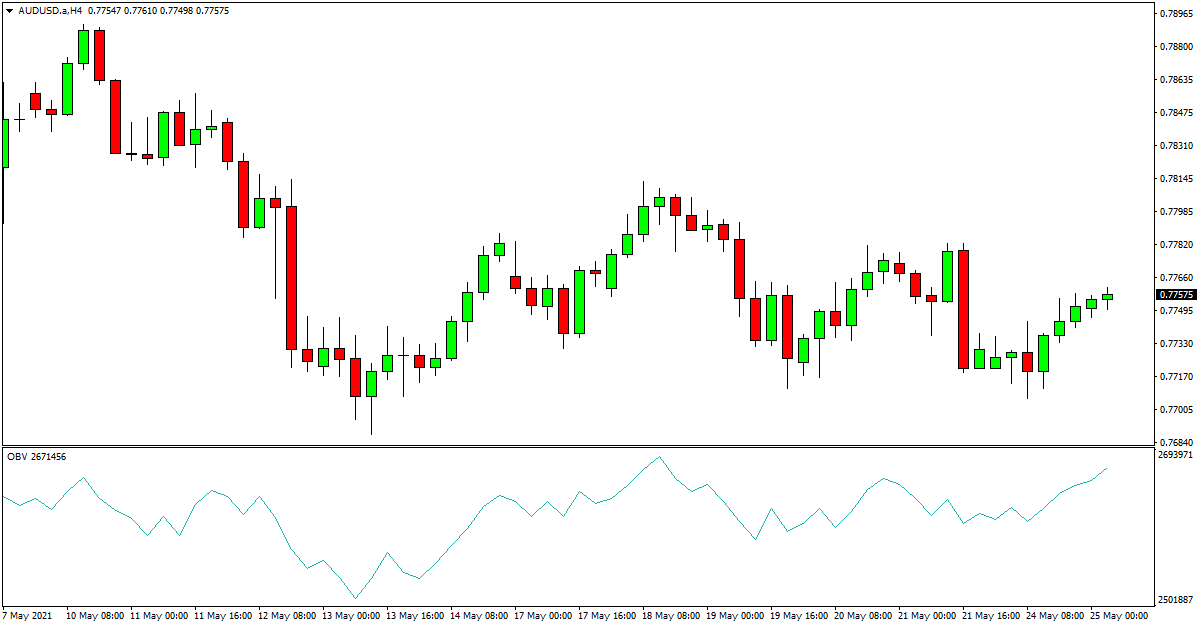
On Balance Volume
The on balance volume indicator is designed to show you when a certain market has been seeing an increase in volume, but the price action has not been moving that much.
The on balance volume indicator, which is often referred to as the OBV, can give you a clue of what the larger market players are doing and if they are increasing their positions.
When larger market players like institutions start to move into a position, they aim not to see a huge move in price, making their trade less profitable.
This indicator can show you when large amounts of volume are taking place, but the price is not following.
Chaikin Money Flow (CMF)
The Chaikin money flow indicator is one of the more popular indicators for volume analysis. This indicator was created by Marc Chaikin and is used to measure the flow of volume over a certain time period.
With this indicator, you can start to see the buying and selling pressure for any given time frame you have set.
Volume Price Trend Indicator (VPT)
The VPT or volume price trend indicator is a technical analysis tool that can help you determine the strength of a move in price.
This indicator can give you an idea of the supply and demand levels.
The volume price trend indicator will move higher or lower to give you a positive or negative value. It does this by multiplying the volume levels with the change in price for a certain time period.
Buy and Sell MT4 Volume Indicator
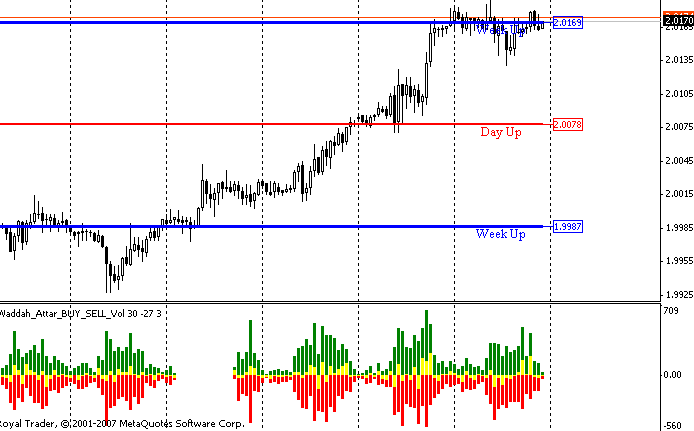
While many indicators give you a different idea of volume levels in the market, this indicator will give you buy and sell signals using volume analysis.
When you have added this MT4 volume indicator to your chart, you will be given red, green, and yellow levels to show you whether it a potential buy, sell, or hold market.
This MT4 buy and sell volume indicator.
Volume Trading Strategy
One of the most common trading strategies is looking for price to breakout through a key level such as an important support or resistance level.
Volume information can help you find these breakouts and also add confirmation.
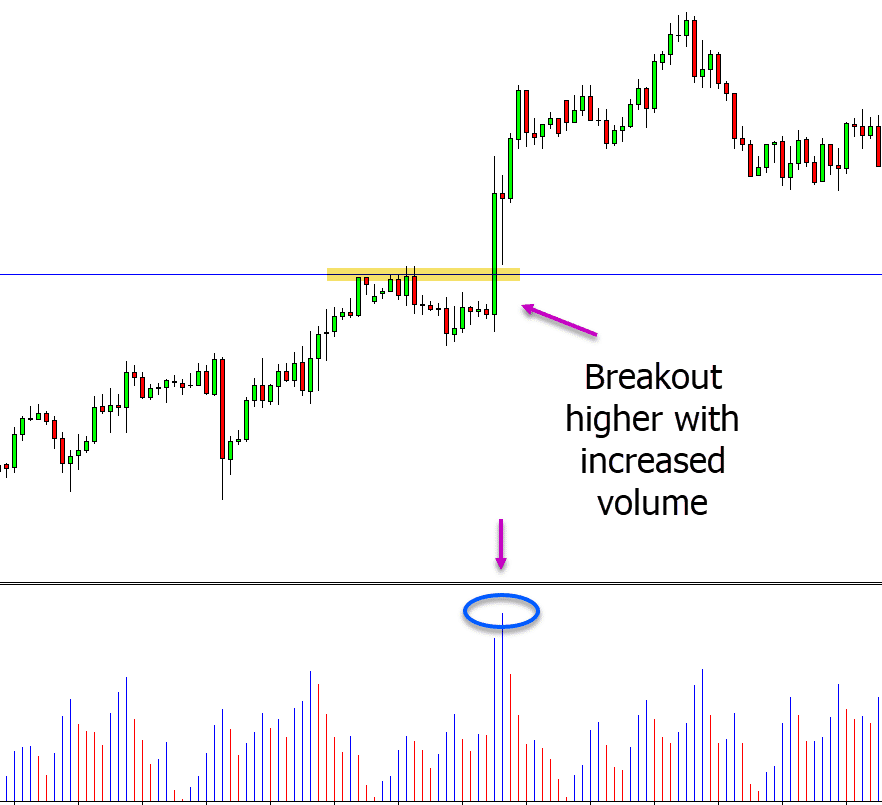
Higher Volume with Breakout
In the example below price is trying to breakout higher and through a resistance level.
When analyzing the volume, we are looking to see that the volume increases and ticks higher before and during the breakout.
On the flip side, if we saw the price was breaking out with a small amount of volume, we should be cautious and potentially look for the breakout to turn into a false breakout.
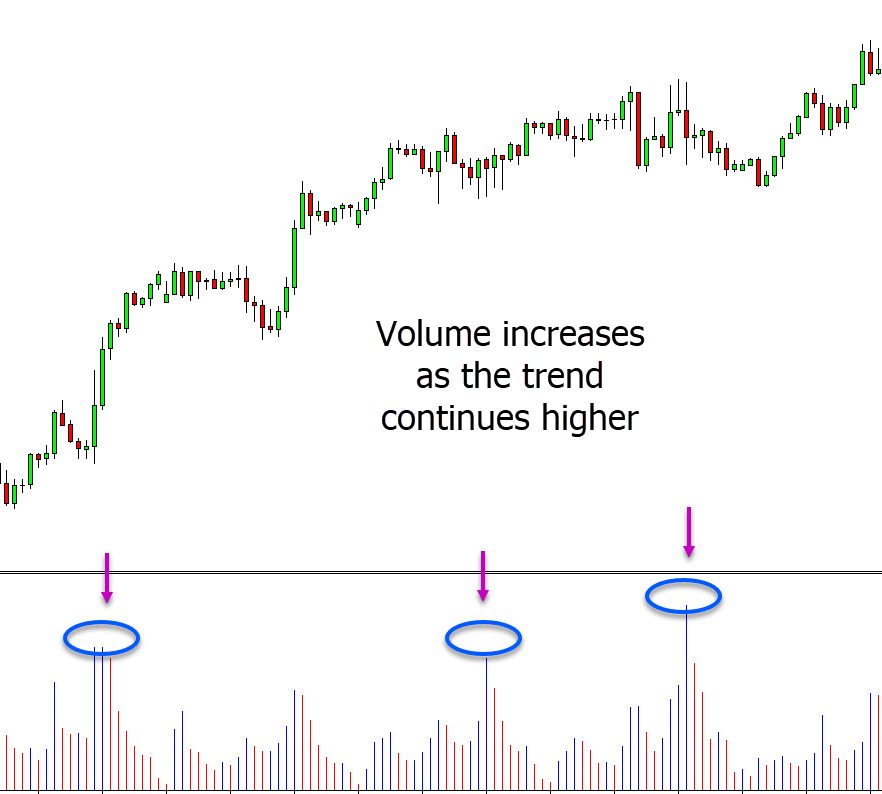
Volume Spike in a Trend
As price trends through the day or session, you should keep an eye out for the volume levels.
In a strong trend, we will continually see a spike in the volume as the trend gains strength. This can be for both higher and lower trends.
In the example below price is in a trend higher. When looking at the volume levels, we can see that prices continually spikes as the trend continues higher.
Volume Trading Strategy for Intraday
A lot of volume indicators are used on the daily charts. However, some indicators can be great at showing you if the volume is spiking or decreasing on an intraday basis.
Best Volume Indicator for Intraday
The on balance volume indicator was created in the 1960s by Joseph Granville.
This indicator tallies the higher and lower volume levels to help you accurately look for breakout or fakeouts.
You can use this indicator to try and get a better idea of what the bigger market players are doing during each session.
These indicators add an oscillator that moves higher and lower to your chart. It is natively installed in MetaTrader charts, and you just have to select it from the indicators section.
The idea behind this indicator is that price will normally follow the volume information.
The on balance volume is mainly used to find when large spikes in the volume occur, but the price is not making the same large movements. This can give you a clue to where the price could head next. The bigger players in the market will normally try to move in when volume levels are minimal to get the best prices. If you notice that volume is increased, then a new move could be about to occur.
NOTE: You can get your free volume trading strategies PDF guide below.
