One of the most popular and commonly used indicators and strategies is the moving average and in particular the 200 EMA trading strategy.
Whilst this is a longer term indicator, it can be extremely useful for finding trends, placing and managing trades and using it with other EMA’s in a crossover strategy.
Table of Contents
What is the 200 EMA
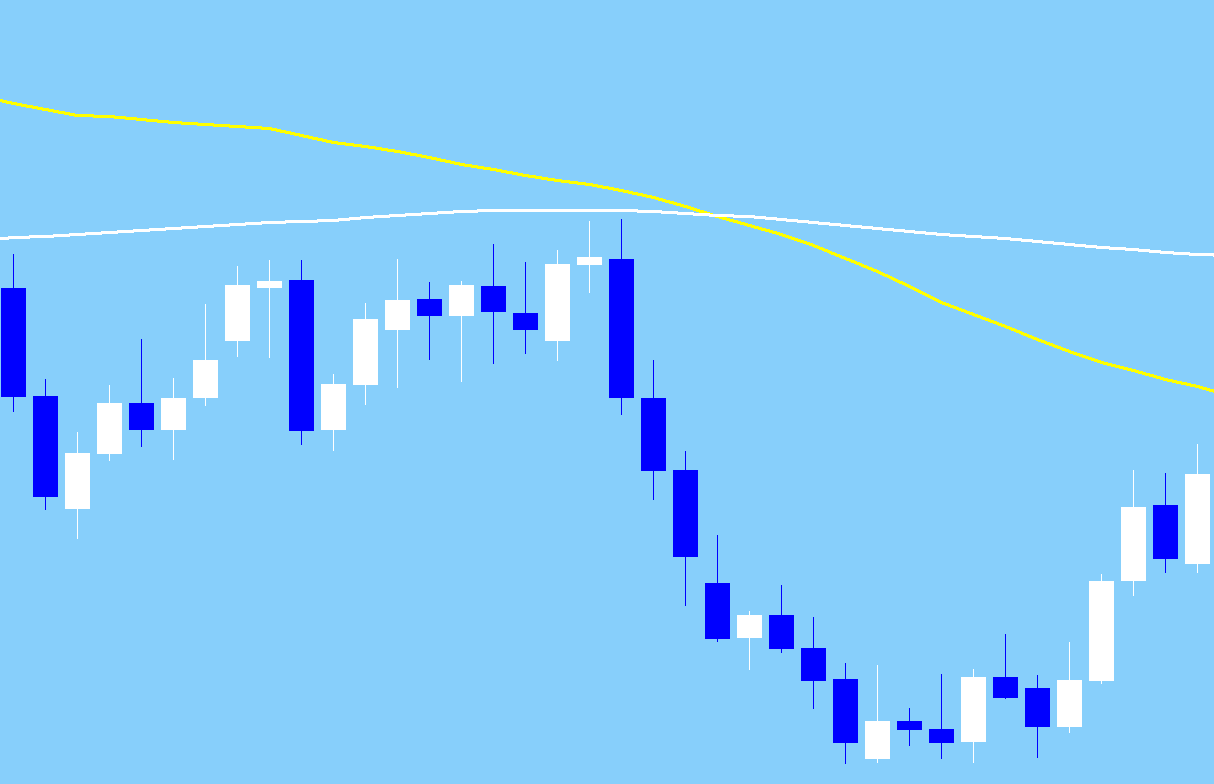
The moving average is an indicator that smooths out the price action’s moves and helps you find clear trends. It can also help you find dynamic support and resistance.
The moving average is created by showing the average price over a set period of candles or time. For example; a 200 day moving average is using the last 200 days price information.
There are two popular forms of moving averages that are used. These are;
1: Simple Moving Average (SMA)
2: Exponential Moving Average (EMA)
The main difference between these two types of moving averages is that the exponential moving average gives more weight to the recent price. This will mean they react faster.
Where a simple moving average averages the price data equally for all periods, the exponential moving average has more emphasis on the recent price.
The 200 period EMA is using the last 200 periods of information to create a moving average on your chart.
You can use this on any time frame to find trends or dynamic support and resistance. For example; if using it on a 15 minute chart, then the 200 EMA will be using the last 200 periods from the 15 minute time frame.
How to Use the 200 EMA Indicator on MT4 and MT5
Setting up and using this indicator in your MT4 or MT5 charts is very simple.
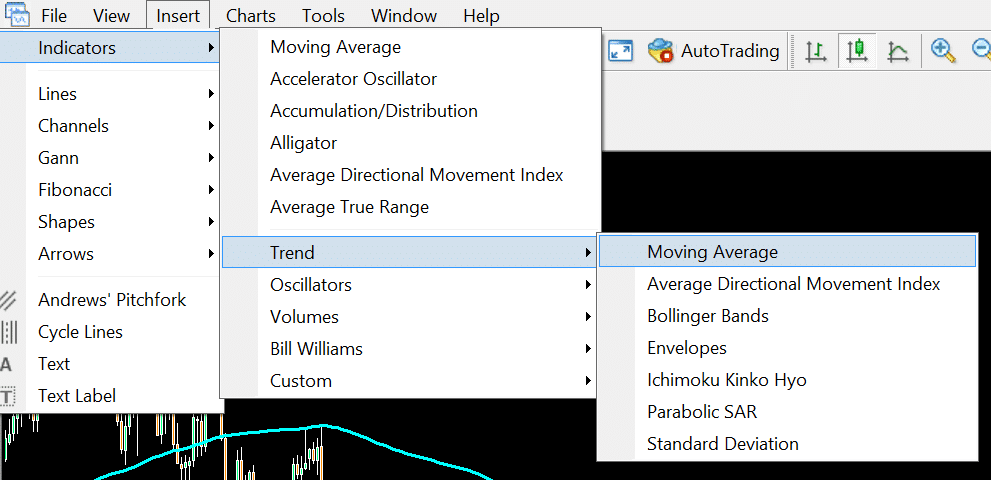
- Open your MT4 / MT5 charts.
- Navigate to “Insert”.
- Click “Indicators” > “ Trend” > “Moving Average”.
Once you have done this a box will open up on your chart and you will be presented with some options.
To start using the 200 EMA select; “200” under the period and “Exponential” under the MA Method boxes. Then, click okay and the moving average will be applied to your chart.
NOTE: If you do not yet have the correct charts make sure you read about the best trading charts and the broker to use the moving average trading strategy with here.
What is the 200 EMA Trading Strategy
The 200 EMA trading strategy is incredibly simple and easy to use. It has a lot of benefits and applications that you could potentially use it in your trading for. You can also use it on all time frames and markets.
The main strategy when using the 200 EMA is identifying larger trends or looking for when trends are changing. This way you can either find new long running trend trades, or exit with healthy profits.
Keep in mind this is a longer term indicator set over 200 periods that is best used to find longer term trends.
How to Use the 200 EMA to Find Trades
There are two main strategies that are normally used to find trades with the 200 EMA.
1: Trend Trades
2: Dynamic support and resistance
Trend Trades
When trend trading with the 200 moving average we are looking for large running trends.
This also means we are looking for larger pip targets with larger stop losses.
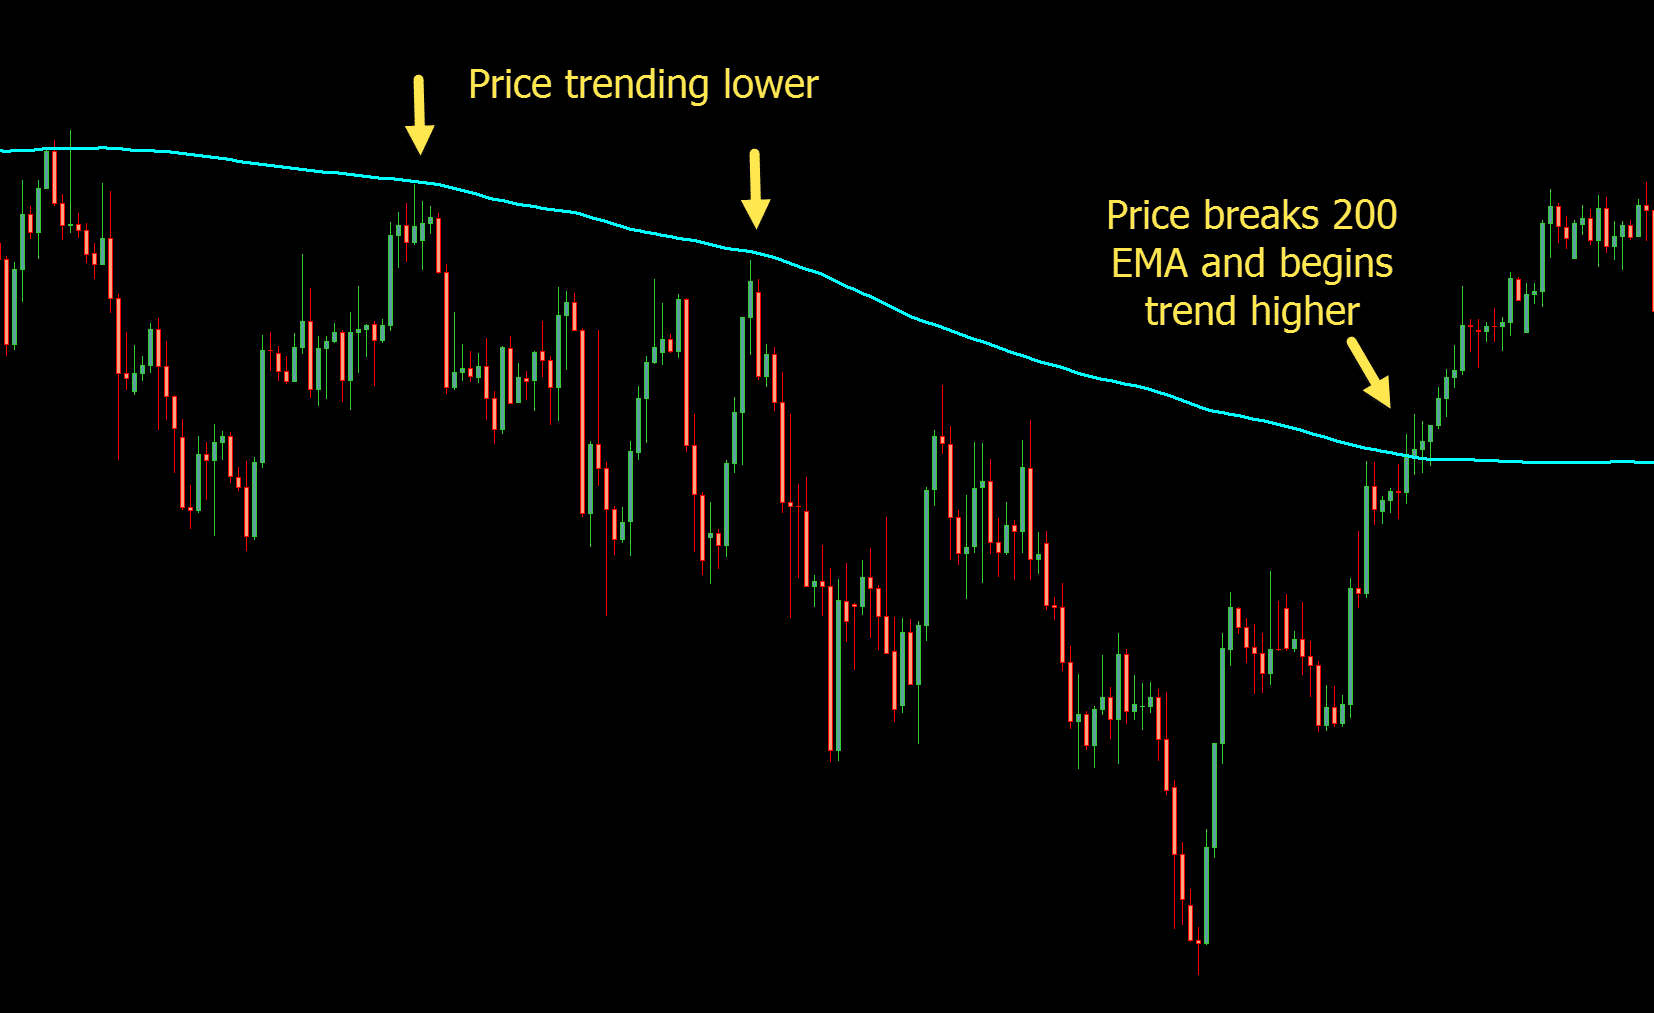
To use the 200 EMA for trend trading we are waiting for a clear direction either higher or lower.
As the chart shows below; the 200 EMA begins to move clearly lower. Price also makes tests at breaking through higher, but can’t and continues to move with the trend.
Eventually the move and trend lower ends and this is signified by the 200 moving average being broken and price beginning a trend back higher.
Dynamic Support and Resistance
One of the other main strategies used with the 200 period moving average is trading the ‘bounces’ off dynamic support and resistance.
Dynamic support and resistance is simply support and resistance that is changing as price is moving higher or lower.
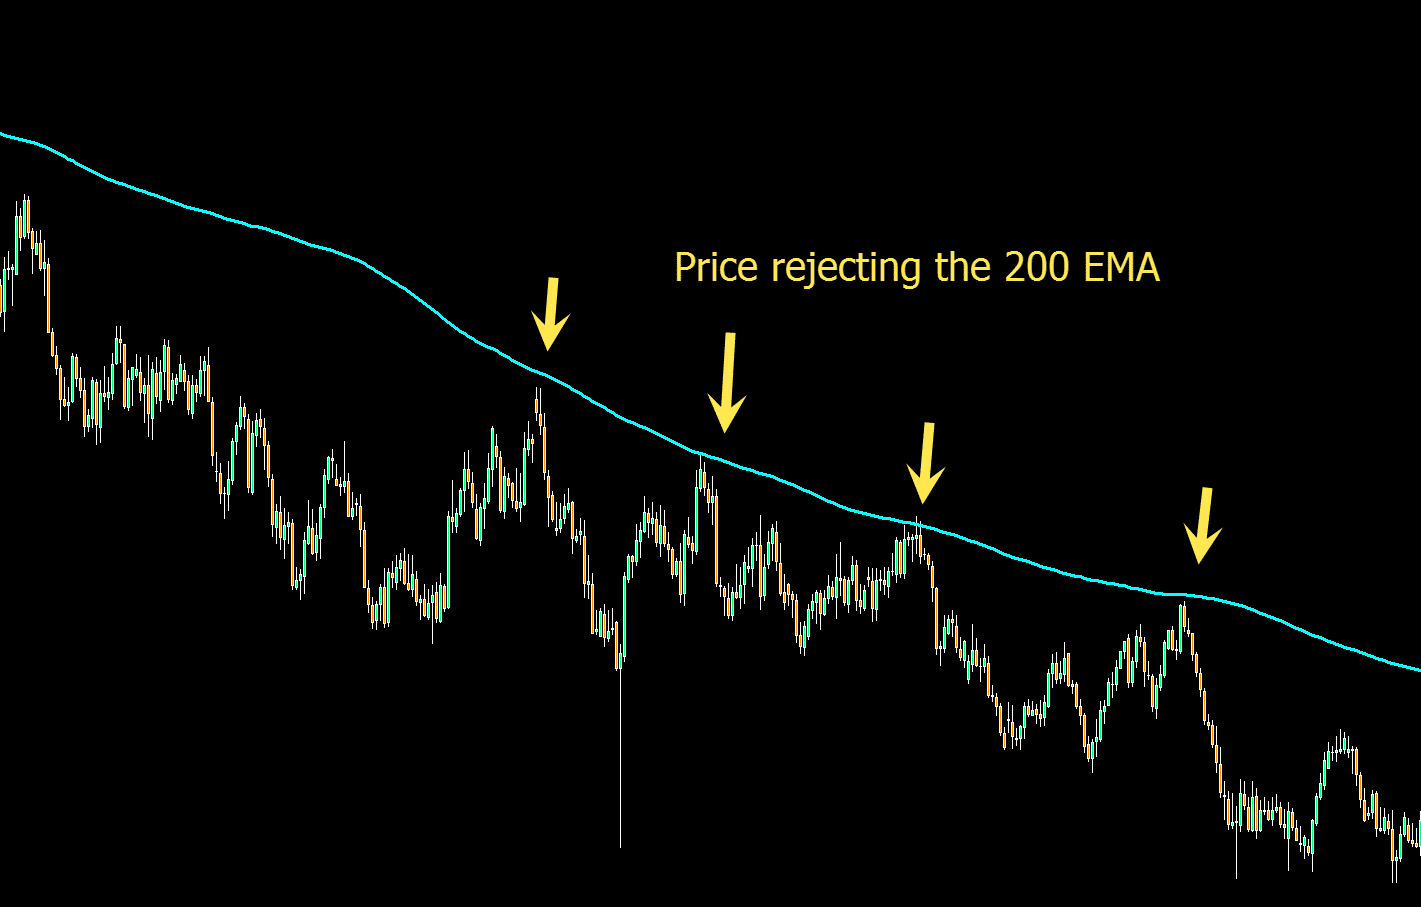
As the first chart shows below; price is in a clear trend lower with the 200 EMA making a solid downward slant.
Price continually tests the 200 moving average, but each time this level holds as a dynamic resistance level and potential area to enter short trades.
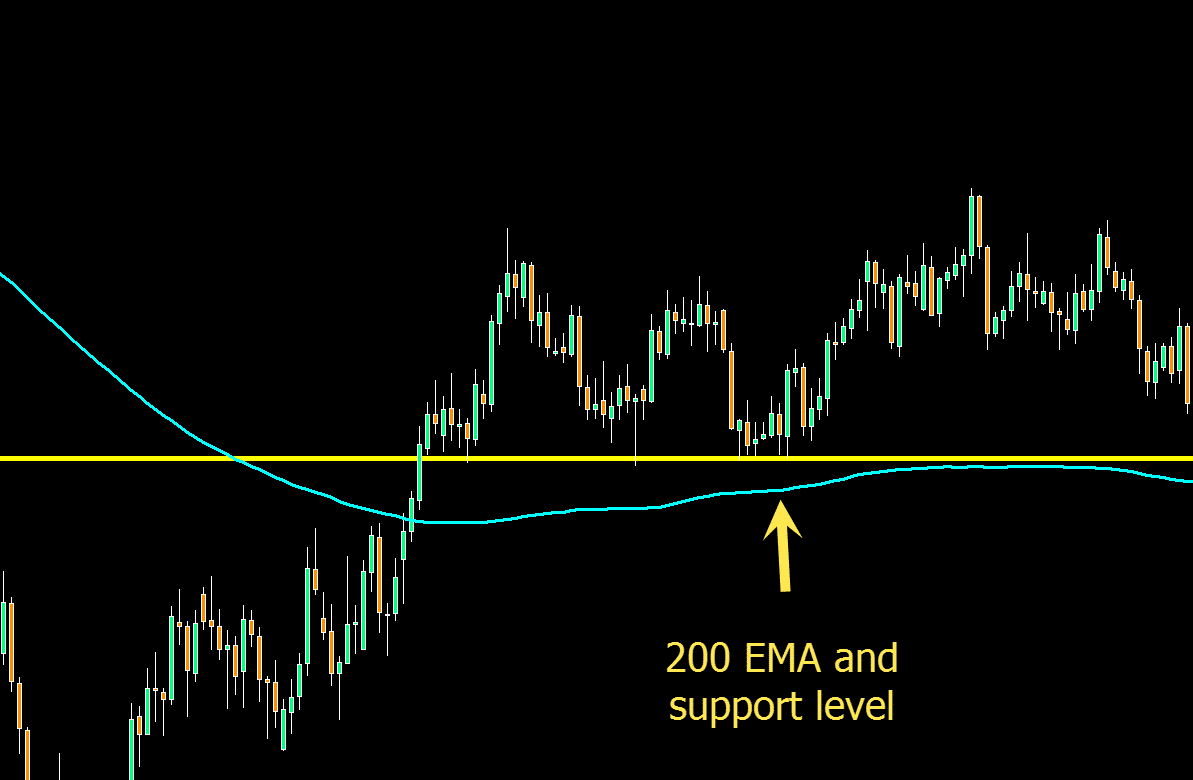
The other way that dynamic support and resistance can be used is in conjunction with standard support and resistance.
You can also use it with your trendlines.
Using them both together will give a higher probability trade and higher confirmation.
As the chart shows below; both the support level and 200 EMA line up to give a possible long trade entry.
EMA 50 Crosses EMA 200 Trading Strategy
A very popular way to use the 200 period moving average is with another smaller period moving average.
The most popular and widely used combination is the 200 and 50 moving average.
The reason for using two moving averages, one a longer period than the other is because the shorter period moving average will react more quickly to what price is doing.
Whilst the 200 moving average is a longer term indicator, the 50 period will remain a lot closer to the price action.
This can tell you a lot about what price is doing and where it could be heading.
Two examples of how the 50 and 200 EMA could be used are;
1: When the 50 crosses the 200.
2: To spot a mean reversion or trend growing momentum.
EMA 50 Crosses EMA 200
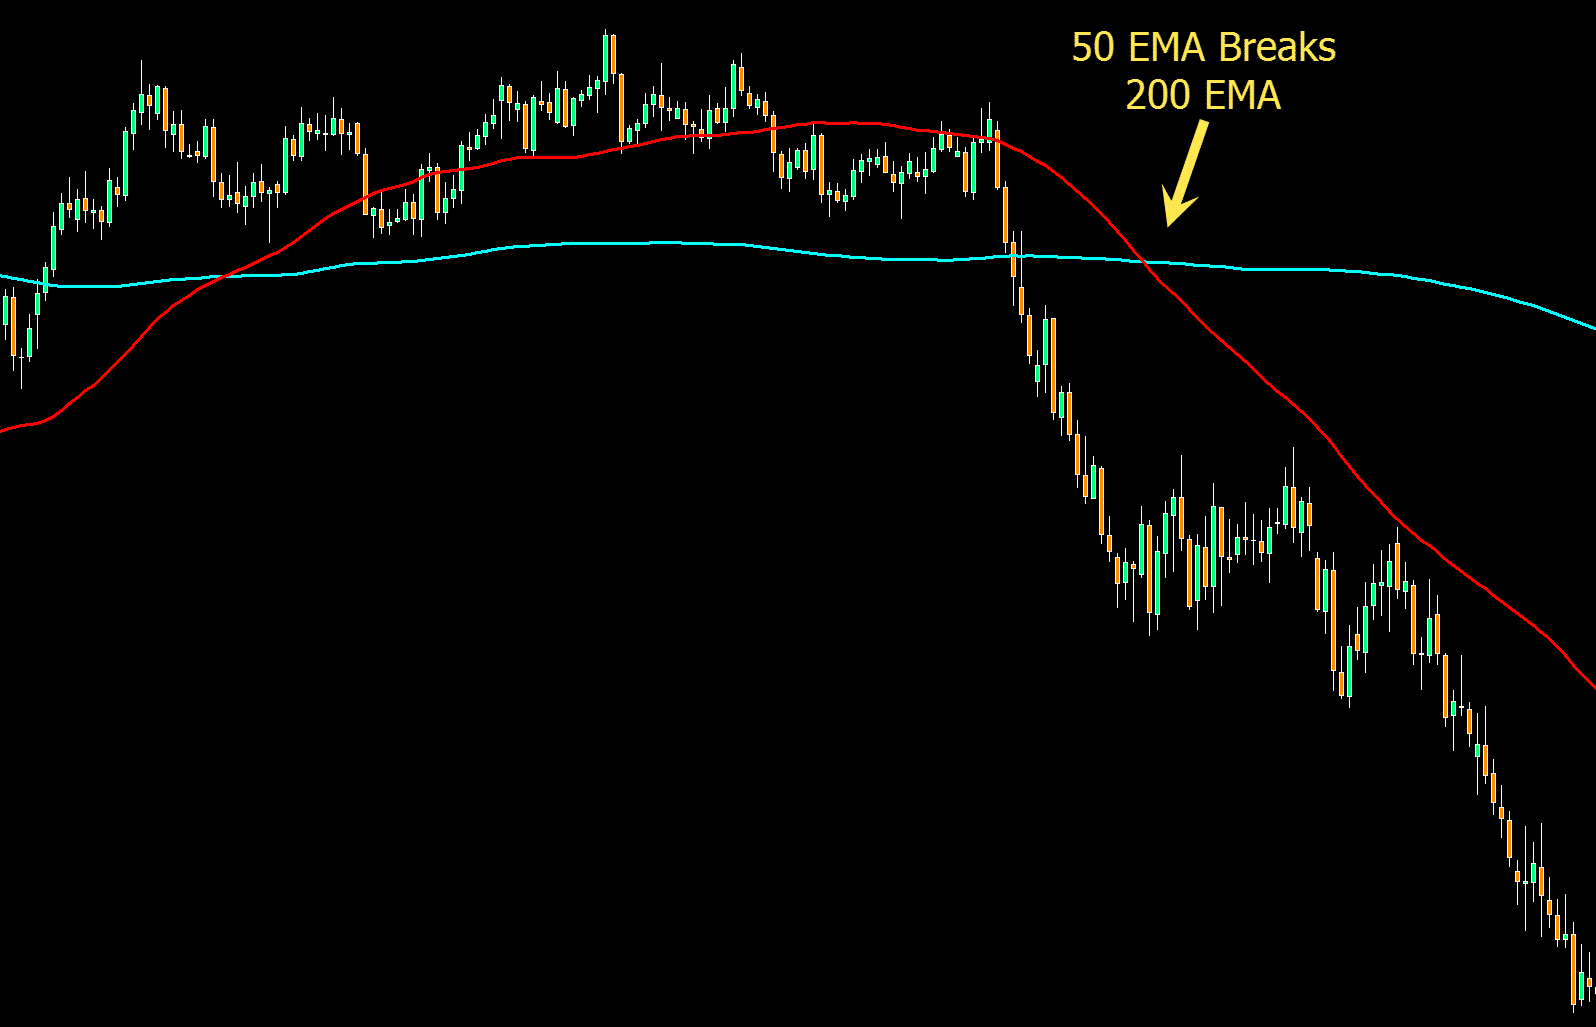
When the 50 EMA crosses the 200 EMA it often signals that the shorter term trend is changing.
As the chart shows below; the 50 EMA breaks below the 200 EMA and price begins to make a strong move lower.
Mean Reversion or Trend Momentum
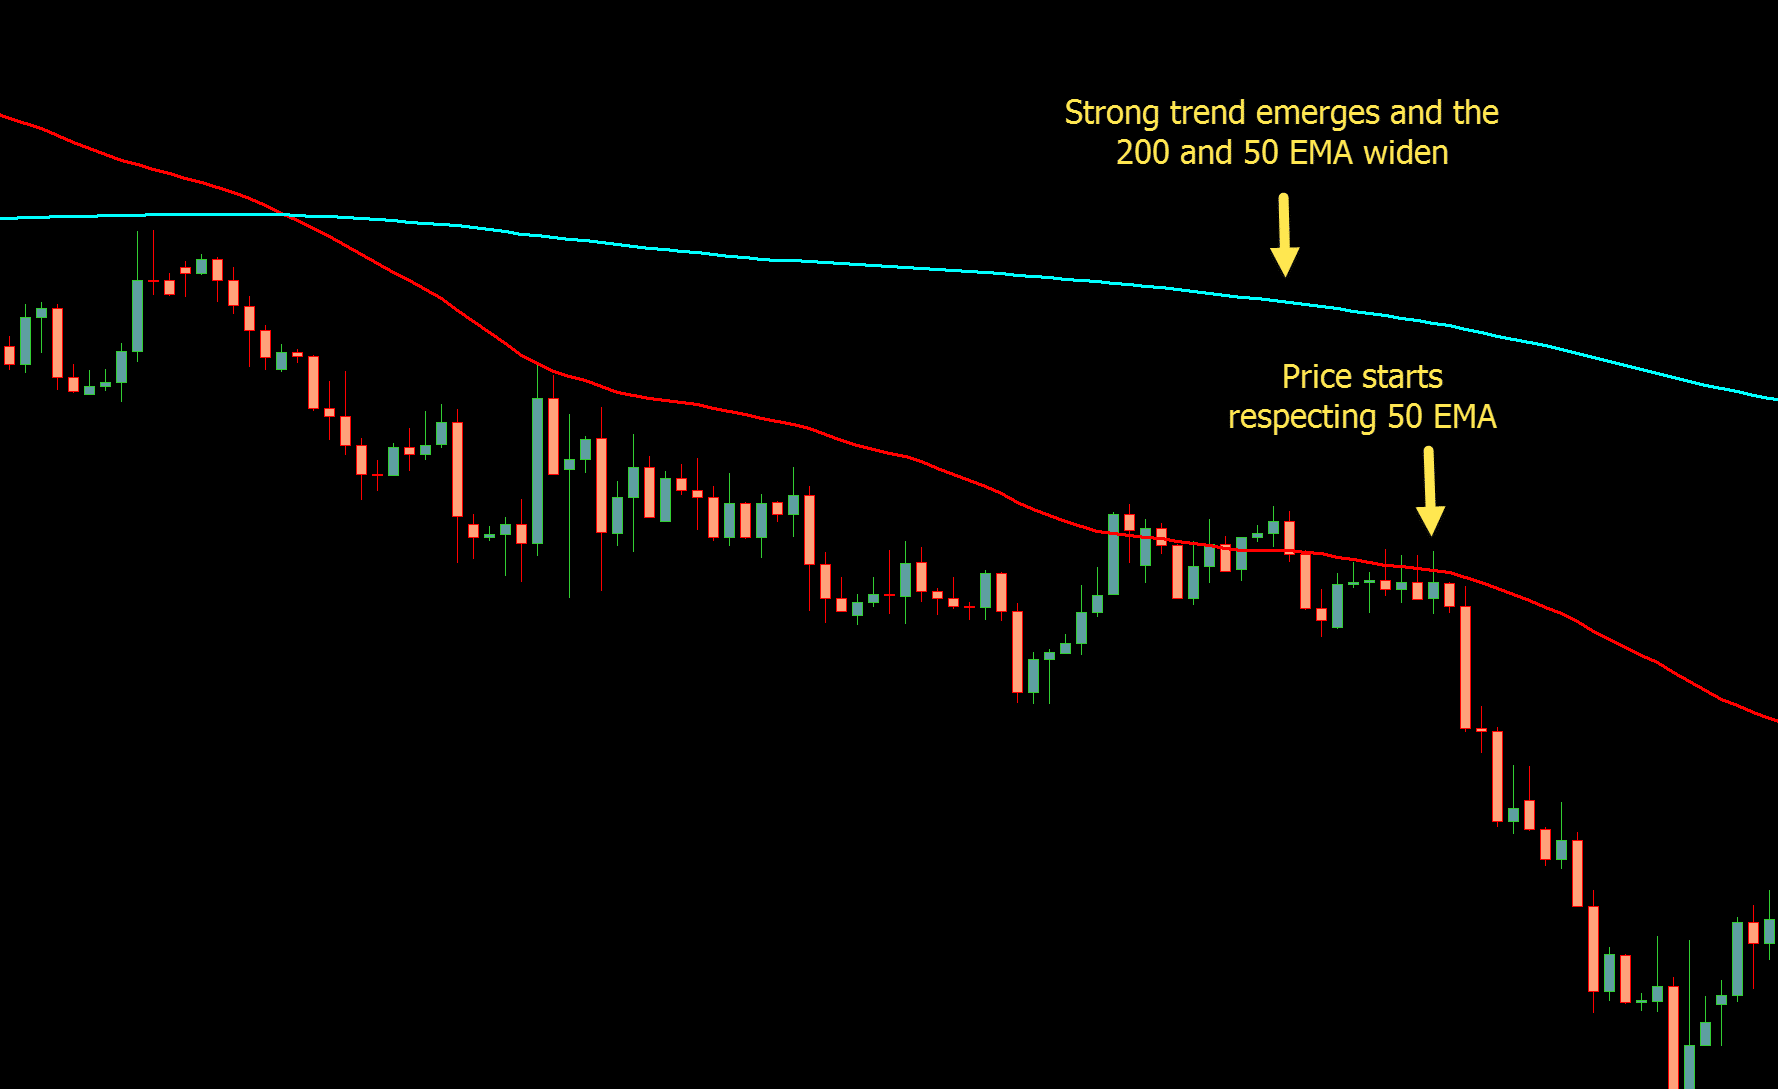
Another way this pair of moving averages is used is to identify the strength of the trend.
When the 50 EMA is moving a long way away from the 200 period EMA it shows a strong trend in one direction.
If they begin to come together it shows price has rotated back to the mean and the trend is stalling.
The Golden Cross and Death Cross
A lot of traders use what is commonly known as the Golden and Death Cross in their trading.
The golden cross refers to when the 50 period moving average breaks through and above the 200 period moving average.
The death cross is the opposite. This is where the 50 period moving average crosses below the 200 period moving average.
As the chart example shows below; price was trading sideways in a range and both the moving averages were close together. Then, the 50 EMA crossed below the 200 EMA and a strong trend lower began.
Lastly
Whilst the 200 EMA is a longer term indicator to help you find longer term trends, when used with other EMA’s such as the 50 period, it can also help you find shorter term moves.
As with all indicators, the EMA is best when traded and confirmed with your other favorite technical analysis. An example of this could be using the 200 EMA with support and resistance or with your candlestick patterns.
