As the prices of securities fluctuate, past price data is recorded and can be observed on what we call price charts.
If you have ever had any interest in the financial markets, you have no doubt seen a price chart before.
Occasionally, the data recorded onto these price charts form patterns. A pattern is simply a recognizable configuration of price movement. These distinctive formations form the basis of what we call technical analysis.
Technical analysts interpret these patterns in an attempt to predict future price movements. The basis of this belief is largely founded in human psychology and herd behavior.
This post will analyze a specific chart pattern known as the ABCD pattern. We examine how to use this pattern, its variations, and a couple of useful indicators that you can use when trading this pattern on the markets.
NOTE: You can get your free ABCD PDF trading guide below.
Table of Contents
What is the ABCD Pattern?
Of all the various price patterns that exist, the ABCD pattern is among the easiest to identify. As you might have deduced from the name, the pattern consists of four separate parts: A, B, C, and D.
The patterns indicate when the price of a security is about to change and begin trending in the opposite direction. For example, if a stock has been trending upward, the ABCD pattern can help you predict when this trend will reverse and begin moving downward.
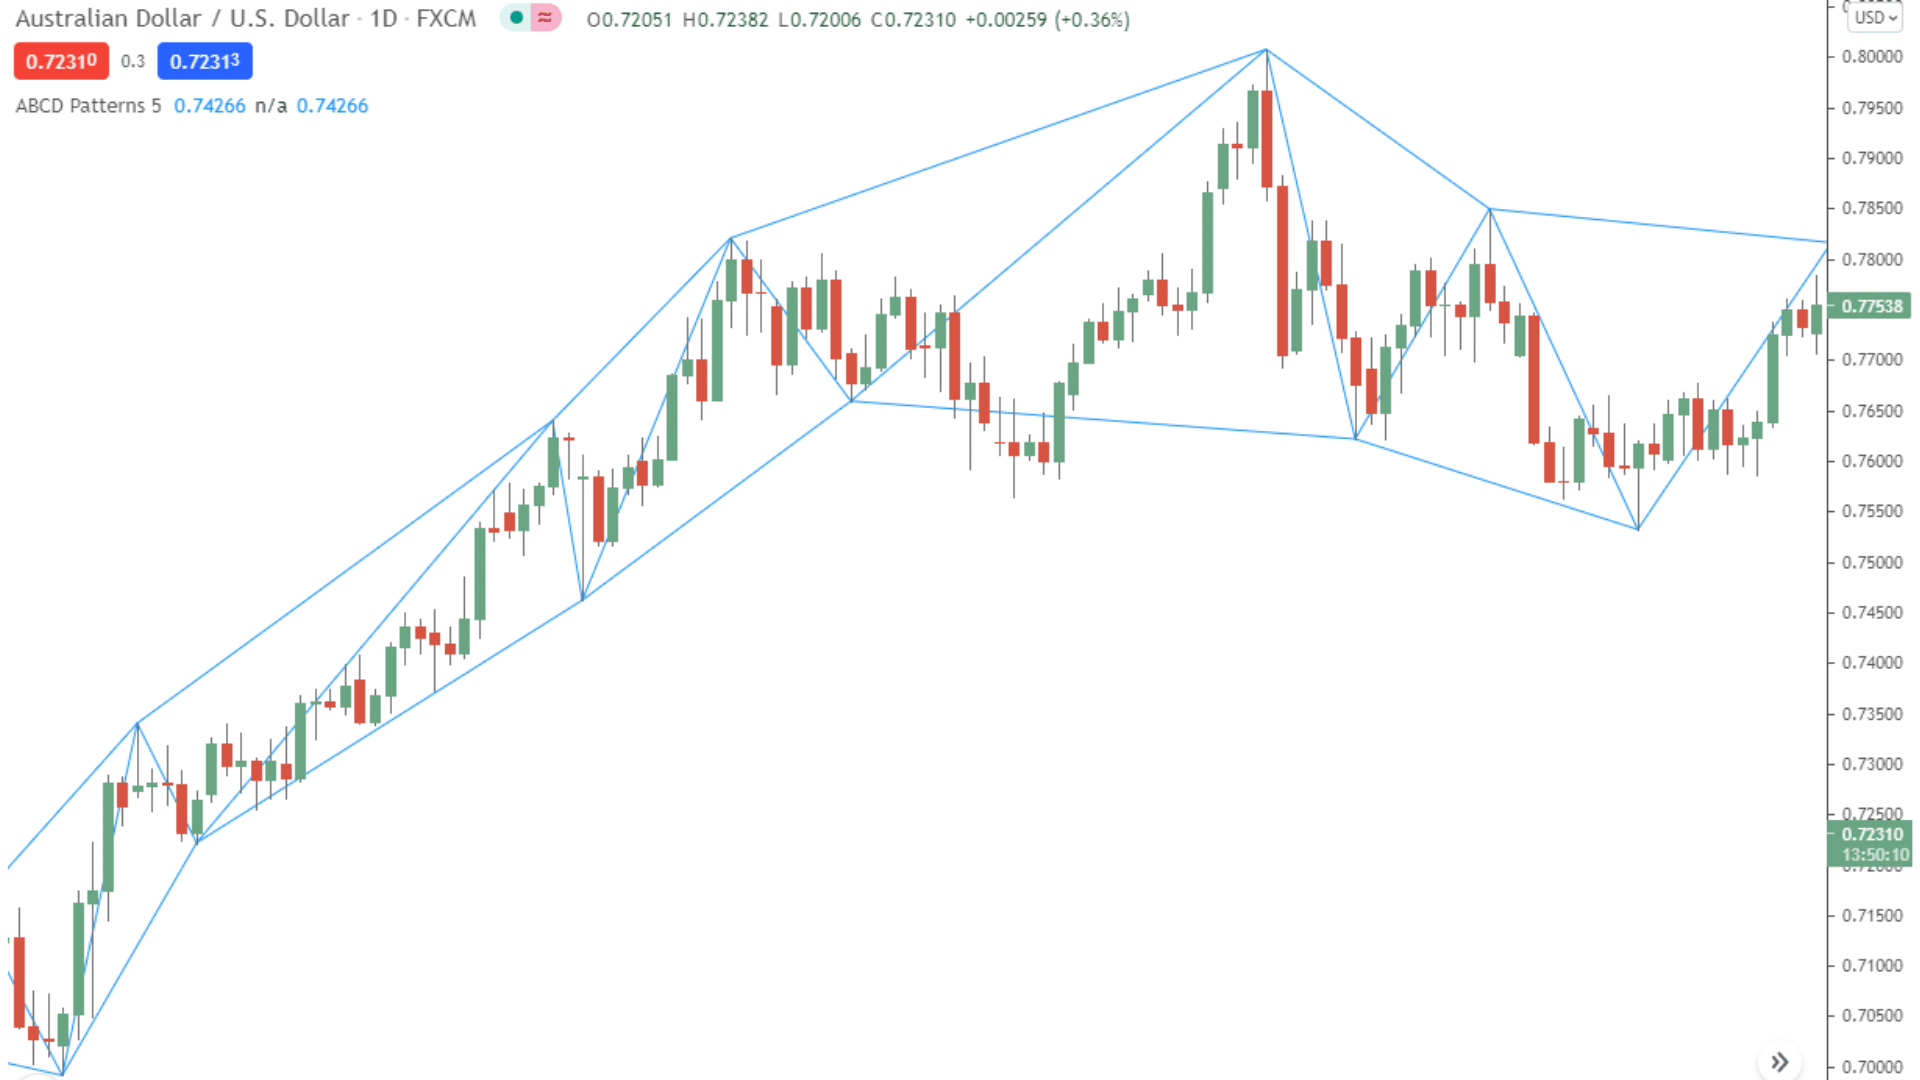
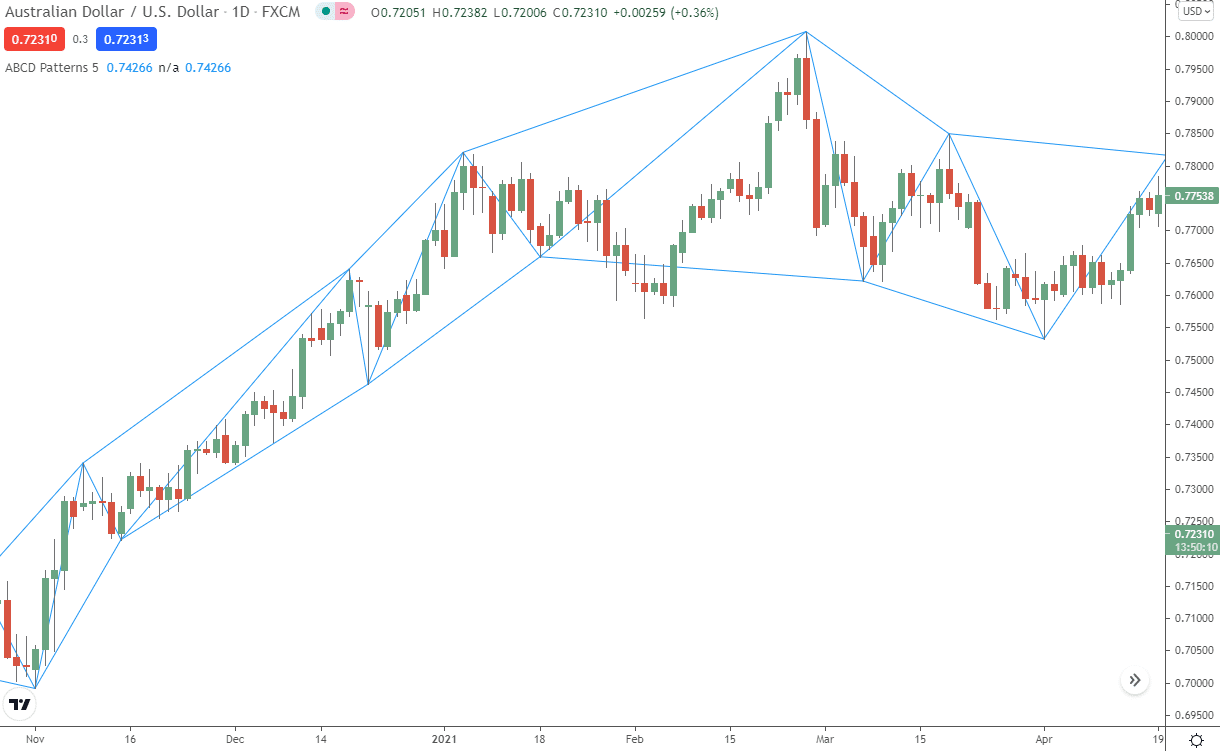
The ABCD pattern can indicate either bullish or bearish reversals depending on the configuration of the pattern. You can see an example of an ABCD pattern below.
How to Use the ABCD Pattern
If you can predict when a trend reversal will occur, you can use that information to your advantage by entering either long or short positions before the reversal. Let’s examine some possible entry and exit points using the ABCD pattern.
Assume that you believe a reversal is imminent on a stock that has been trending upward. You correctly identify a bearish ABCD pattern and are seeking an entry point to open a short position.
In a bearish ABCD pattern, you would be looking for the price to rise initially from (A) to a new high of the day (B). After the price reaches (B), you would be waiting for a dip back down to support (C). The support (C) should be higher than the initial point (A). Once support has been established at (C), you are almost ready to enter a short position. The price should begin to rise from its support at (C) up to a new high. This new high is (D). Once the price reaches (D), this is the optimal point to enter a short position.
If the pattern holds, the trend should reverse at (D), and your short position should become possible.
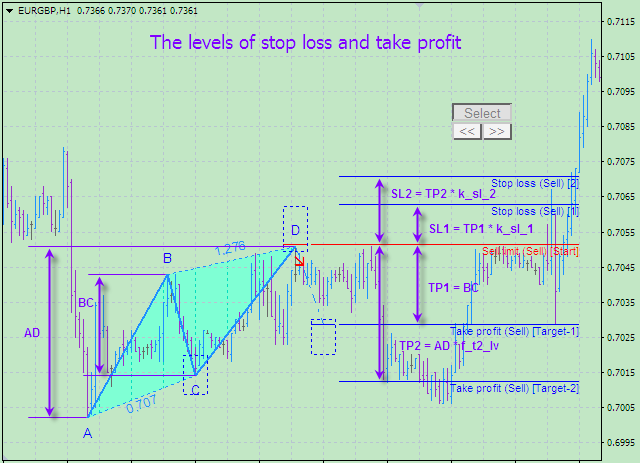
Once you have located an entry position, you should begin to consider when to exit the trade.
As a general rule, your exit target should be twice as much as your risk. Therefore, if you enter a $100 position and have a stop-loss order at $90, your take-profit order should be at $120, double the amount you stand to lose.
When attempting to trade a bullish reversal on a stock that has been trending downward, you would oppositely approach the trade. You can see an example of a bullish reversal pattern in the section below.
XABCD Pattern
The XABCD patterns are similar trend reversals to the original ABCD pattern. There are numerous XABCD patterns, but the four most popular patterns are:
- Gartley.
- Butterfly.
- Crab.
- Bat.
These patterns can either be bearish or bullish, depending on their configuration. They are made up of five-point chart patterns and can be more difficult to locate because they consist of various measurements and ratios. Thankfully, there are some online tools available to help you identify these patterns more easily.
Bullish ABCD Pattern
Ironically, the bullish ABCD pattern begins with a sharp move downwards.
Intense selling pressure leads to a sharp decrease in the security price (A), after which the price rises back up as more and more people begin to buy the dip (B). After this rise, selling volume will again increase, sending the security price back down to a support level lower than (A); we can call this support level (C). After this last fall in price, the trend should reverse, and the security price should begin its uptrend (D).
Bearish ABCD Pattern
As with the bullish ABCD pattern, the bearish pattern begins with a sharp move to the upside. The pattern is essentially the opposite of the bullish pattern, rising where the bull pattern falls and falling where the bull pattern rises. At (D), the uptrend should reverse and begin to turn into a downtrend.
ABCD Pattern Indicator MT4
For those of you who are trading using the MT4 platform, custom ABCD pattern indicators built into the platform can help you identify these patterns more easily. You can find a link to download the ABCD pattern indicator below.
Please note that this indicator is a premium indicator and, at the time of writing, it is priced at $99.
Read more about the ABCD indicator for MT4 here.
ABCD Pattern Indicator MT5
Like the MT4 platform, MT5 also has its own custom ABCD indicator available to download.
This is a premium indicator and you can download it from the link below for $99.
Read more about the ABCD indicator for MT5 here.
Note: Don’t know how to install and use these indicators? Read How to Download, Install and Use MT4 and MT5 Indicators.
Lastly
A common saying among members of the financial community is that past performance is not indicative of future results.
Active traders would be well advised to commit this phrase to memory. Whilst chart patterns certainly provide traders with a statistical advantage, they in no way guarantee a successful trade.
Price movements regularly deviate from potential trading patterns, and the security price may behave differently than the pattern may suggest. Traders should always remember to effectively manage their risk with stop-loss orders and proper capital allocation.
