Identifying and accurately making trend reversal trades can open up a whole new avenue of trading opportunities.
Whilst trading with the trend is often preferred for high probability trade entries, some of the highest reward trades are made when entering trend reversals. One of the best ways to find new potential trend reversals is by using some popular indicators.
This post goes through exactly what trend reversal trading is and how you can use indicators to find and make trend reversal trades.
Table of Contents
What are Trend Reversal Patterns?
There are many ways you can start to identify trend reversals. One way price action traders will spot new potential trend reversals is with price action patterns that are forming through the price action.
These patterns range from one and two candlestick patterns such as the engulfing bar pattern to larger patterns such as the 1,2,3 trend reversal pattern.
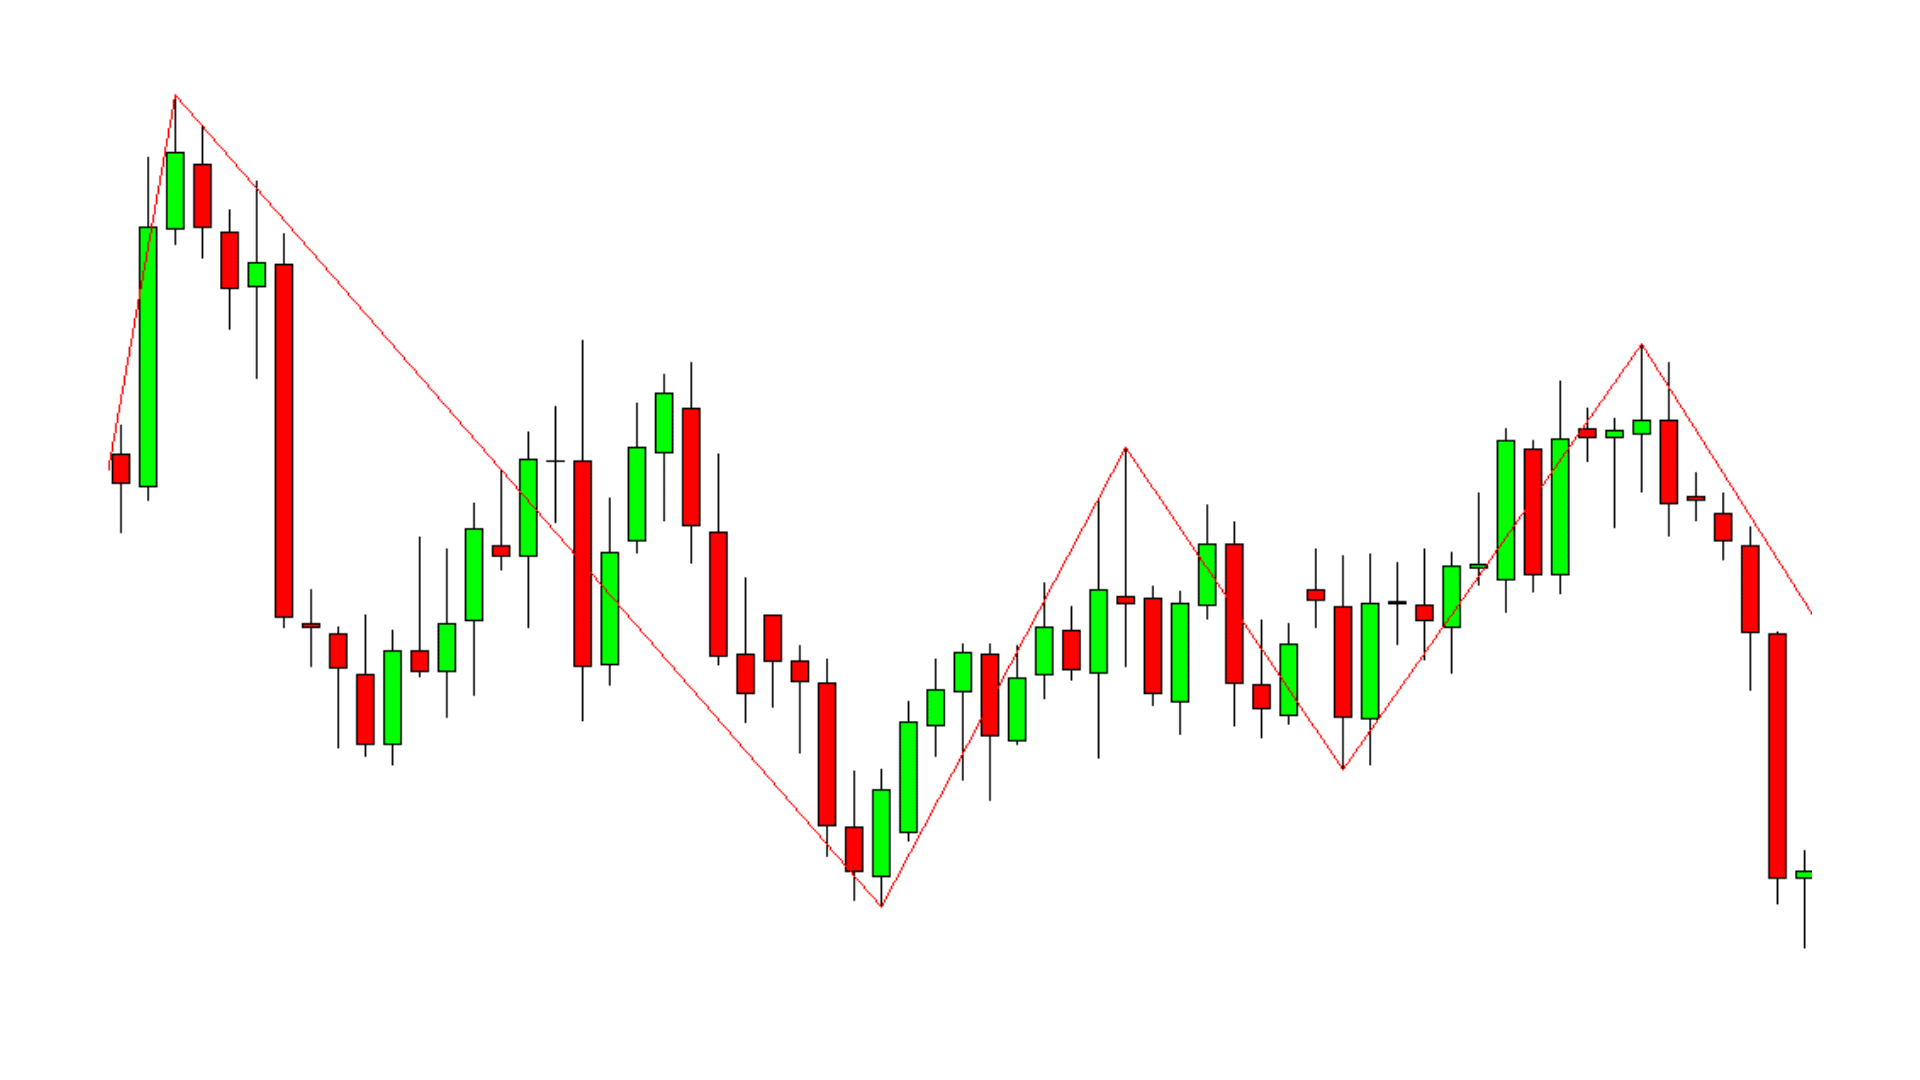
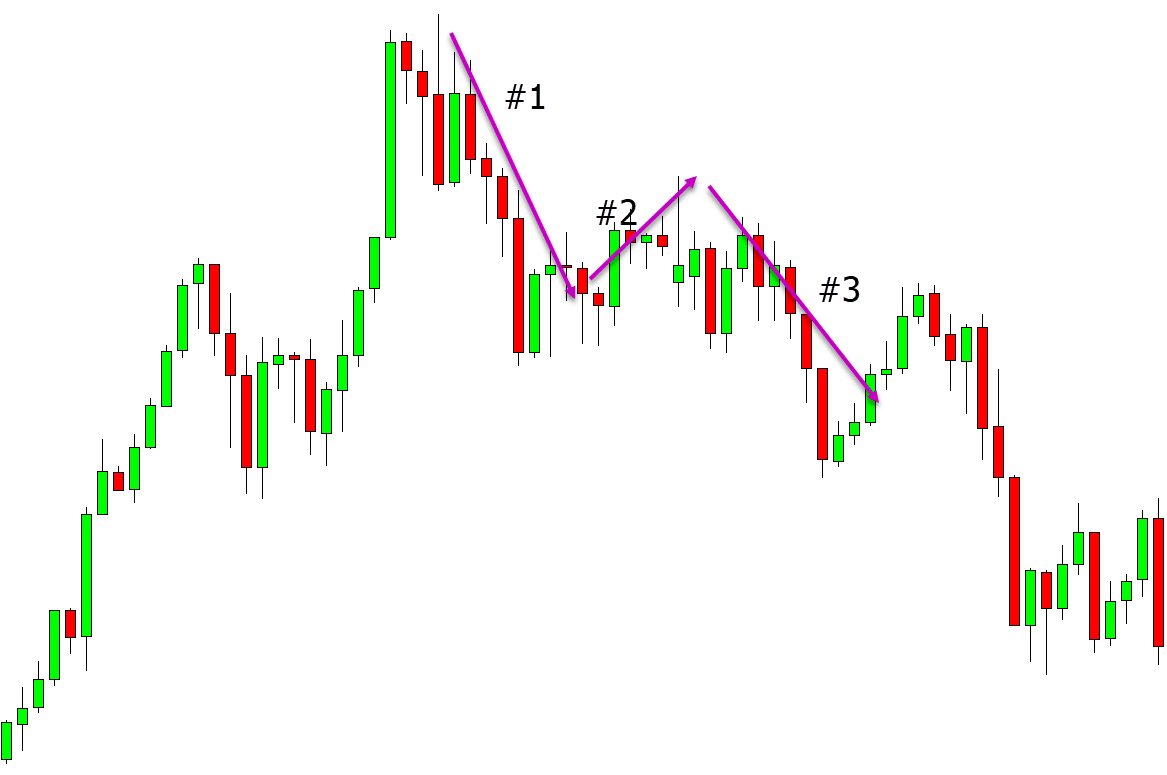
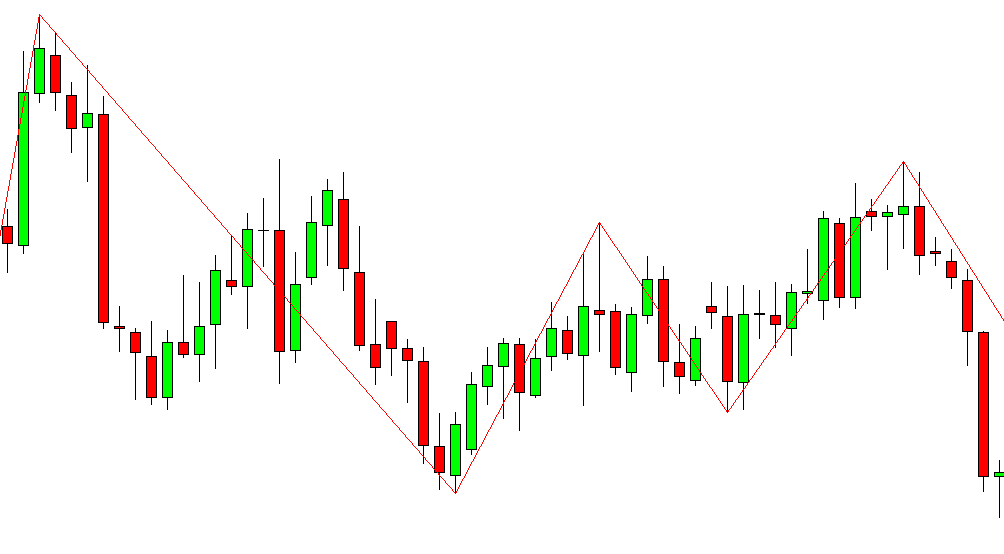
The example below shows a 123 reversal pattern in play. First of all, the price had been in a trend higher. We can then see price forms a new leg lower followed by a new lower high, and to complete the pattern, the new lower low showing momentum has changed to the downside.
The Best Trend Reversal Indicators
Trendlines
One of the simplest ways to find market reversals is using trendlines.
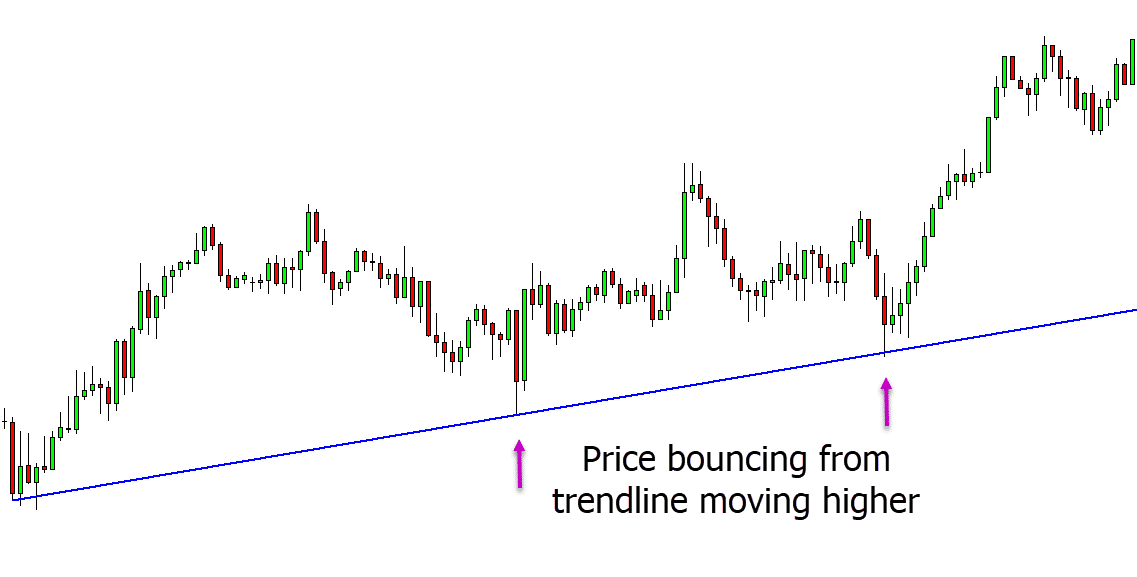
With trendlines, you are either looking for a bounce or a break. A bounce is when price holds as that trendline, and the trendline acts as either support or resistance.
The example below shows that price continually moves lower into the trendline before it holds as support and bounces with a reversal.
Channels
Following on from trendlines are channels.
Channels are very similar to trendlines. However, the difference is that you have two trendlines running in a channel, either higher or lower.
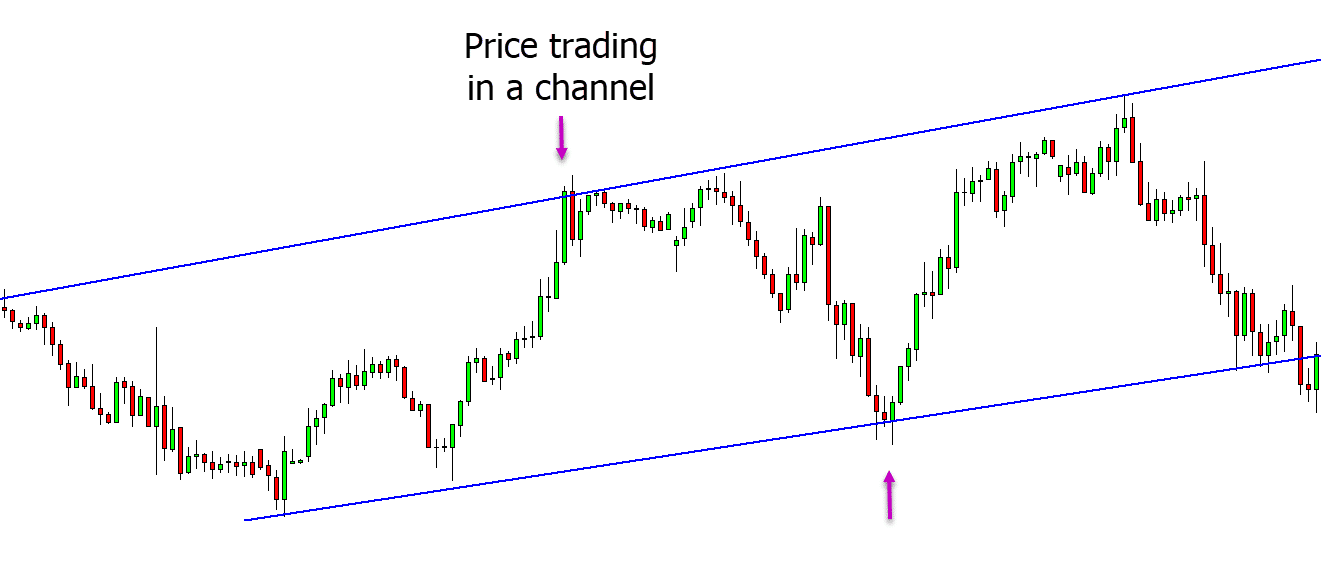
You can use channels in the same way you use trendlines, looking for price to make a reversal when the channel’s high or low is touched.
In the example below, we have a channel moving higher. As the channel high is touched by the price, we can see a reversal back lower. As the channel low is touched, we can see a reversal back higher.
Moving Averages
Moving averages are one of the most popular indicators across many different market types. You can use them on all time frames, and they are very flexible.
The idea of using moving averages is to smooth out the price action information and give you an overall idea of the trends direction. However, you can gain more information than just the overall trend.
When using multiple moving averages, you can identify when a trend is changing and when a trend is gaining momentum.
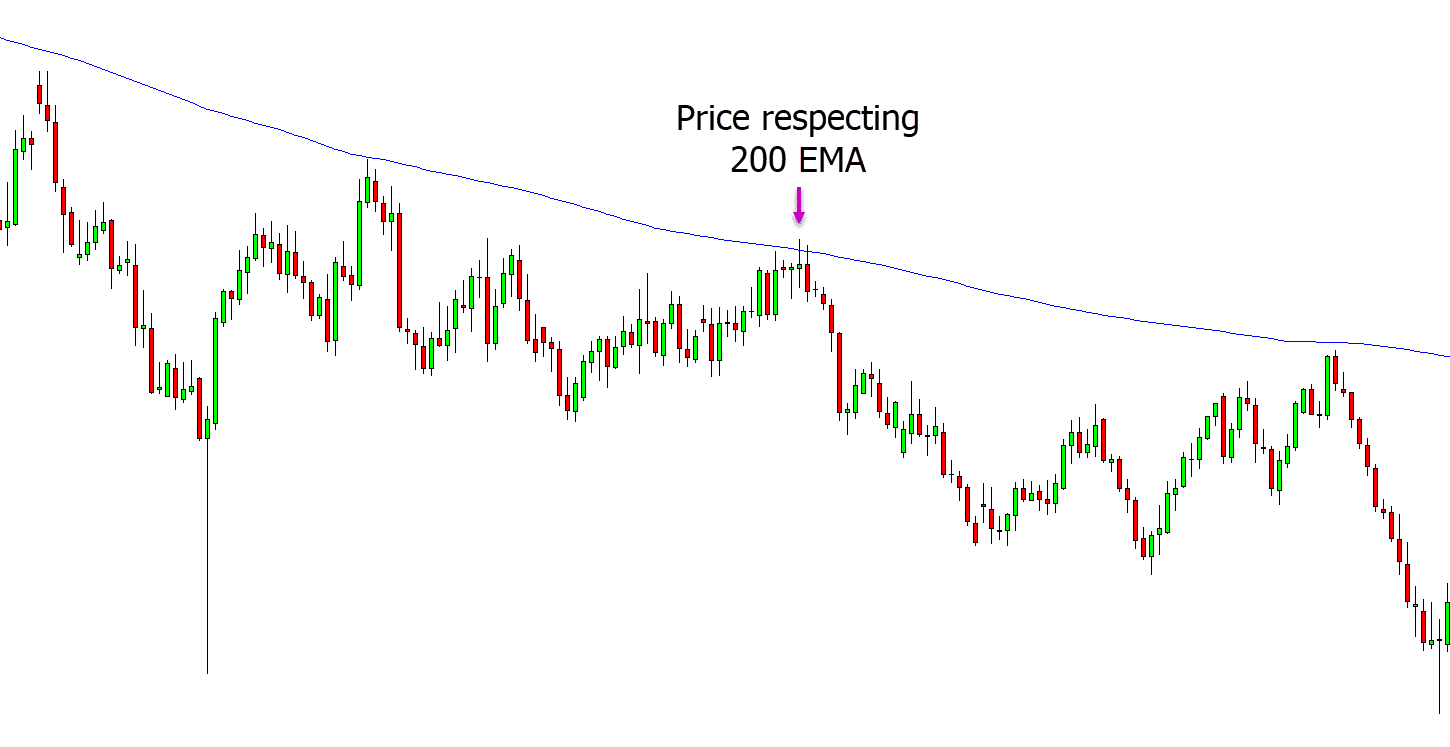
You can also use moving averages to identify potential areas of dynamic support and resistance as the moving average moves higher or lower.
MACD
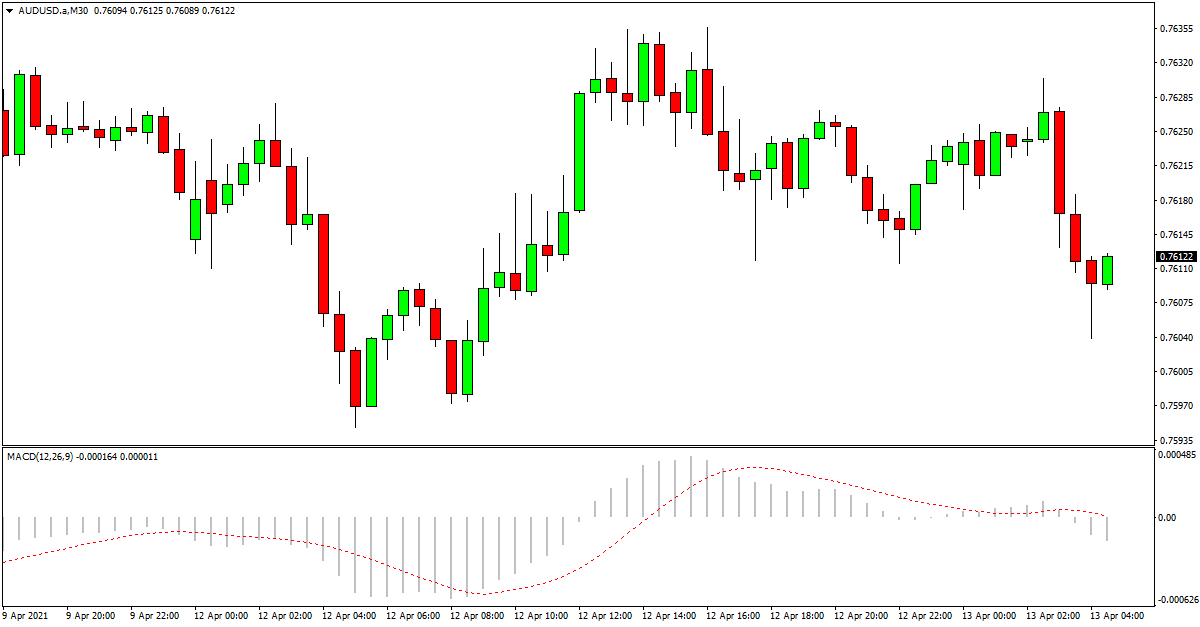
The MACD is a momentum indicator that you can use on all of your favorite market types.
This indicator gives you buy and sell signals, and it can also help you identify when a market is overbought or oversold.
You can use the MACD to identify bullish and bearish momentum and to find and manage your trades.
Zig Zag Indicator
The Zig Zag indicator is one of the more simple indicators that you can use in your trading. When applied to your charts, the Zig Zag indicator will plot lines on your charts showing you the clear swings higher and lower. It will filter out the small and minor price action and only show the clear overall moves.
With this indicator, you can filter out as much of the noise as you would like so that only the more significant swings are shown. This can help you find overall bigger moves and not jump on every small swing higher and lower.
You can use the Zig Zag levels to find obvious trends, potential changes in momentum, mark clean support or resistance levels, or help with your other technical analysis.
The Best Trend Reversal Indicators for Intraday
Whilst trend reversal trading on the intraday charts can be a riskier trading strategy; it can also come with higher rewards. If you can enter a trend when it is first beginning, you have the chance to make far higher reward winning trades.
Some of the best and highest probability intraday strategies for trend reversals are when you combine multiple indicators or methods.
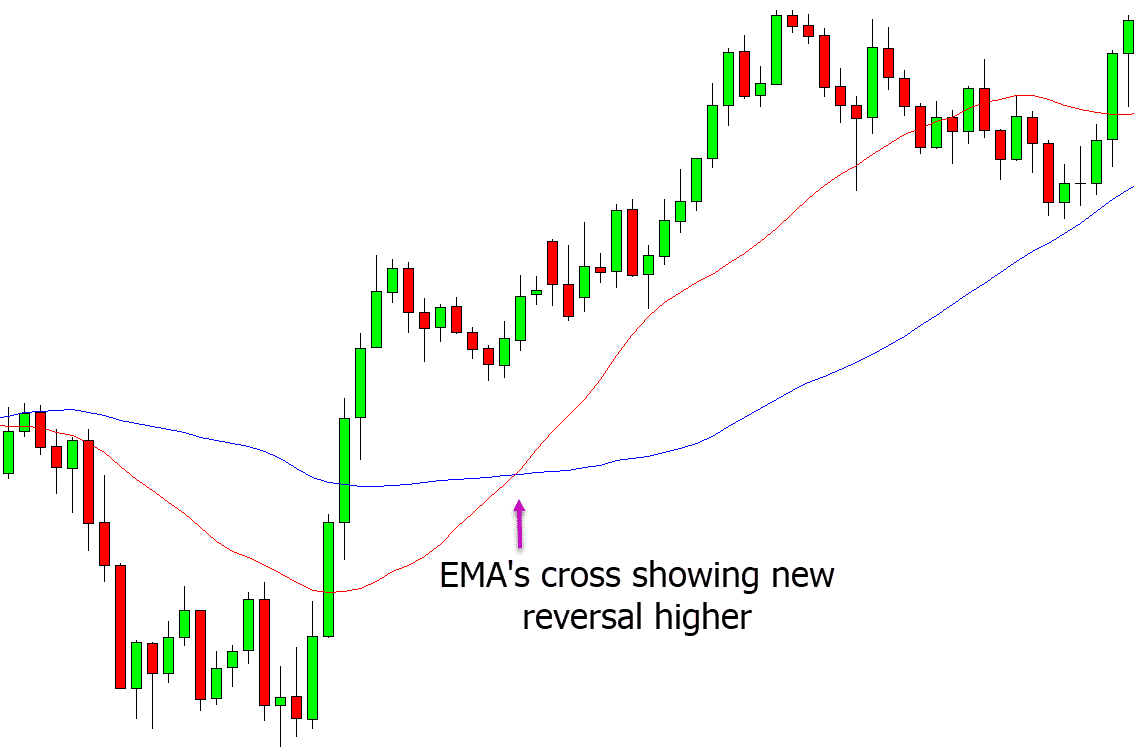
For example, see the chart below. This chart has combined multiple moving averages. The first is a longer-term 50 period moving average, and the second a faster reacting 21 period moving average.
When we see the faster moving 21 period moving average cross above the 50 periods, we can begin to look for new long trades with the trend higher. As the moving averages begin to widen, we also see that the momentum higher is gaining.
To further increase our chance of making a winning trade, we could use other strategies like candlestick patterns or waiting for the price to test the moving averages as dynamic support to make a long trade.
Trend Reversal Indicator MT4
This MT4 trend reversal indicator is a non-repainting indicator that looks to capture new trend reversals.
This indicator looks to find the key swing highs and lows and give you clear buy and sell signals.
The trend reversal MT4 indicator comes with a clear set of instructions and also has built-in alerts.
This is a premium indicator that comes with a demo you can try for free, and you can test it out here; MT4 trend reversal indicator.
Trend Reversal Indicator MT5
This is a MT5 trend reversal indicator that uses simple bullish and bearish price patterns.
These include;
- Bullish Reversal: Two bearish candlesticks followed by one bullish candlestick. The third candlestick’s close exceeds the high of the previous candlestick.
- Bearish Reversal: Two bullish candlesticks followed by one bearish candlestick. The third candlestick’s close price is lower than the low of the previous candlestick.
This indicator comes with a range of inputs and settings and allows you to create custom Metatrader notifications.
Get the MT5 trend reversal indicator here.
