The Elliott wave theory is based on the theory that the price of a certain asset tends to move with similar patterns.
Ralph Nelson Elliott created the theory after observing that price tends to move in repetitive patterns and waves. He would then use these patterns to predict the future of where prices could move.
In this post, we go through exactly what Elliott wave trading is and how you can use it in your own trading.
NOTE: You can get your free Elliott wave patterns strategies PDF guide below.
Table of Contents
Elliott Wave Principle
The Elliott wave principle believes that trending markets will normally move in five waves and then against the trend with three waves.
The five movements with the trend are referred to as motive waves, and the moves against the trend are called corrective waves.
You can use these waves on many different markets and time frames to find key areas in the market and find high probability trade entries.
Elliott Wave Trading System
The Elliott wave trading system has set rules that must be met.
These include;
- The second wave does not retrace 100% of the first wave. Normally this retracement will not move past the 61.8% Fibonacci level.
- The fourth wave does not retrace past 100% of the third wave.
- The third wave has to move beyond the high or low of the first wave.
Elliott Wave Patterns
The two main patterns that the Elliott wave follows are the motive phase and the corrective phase.
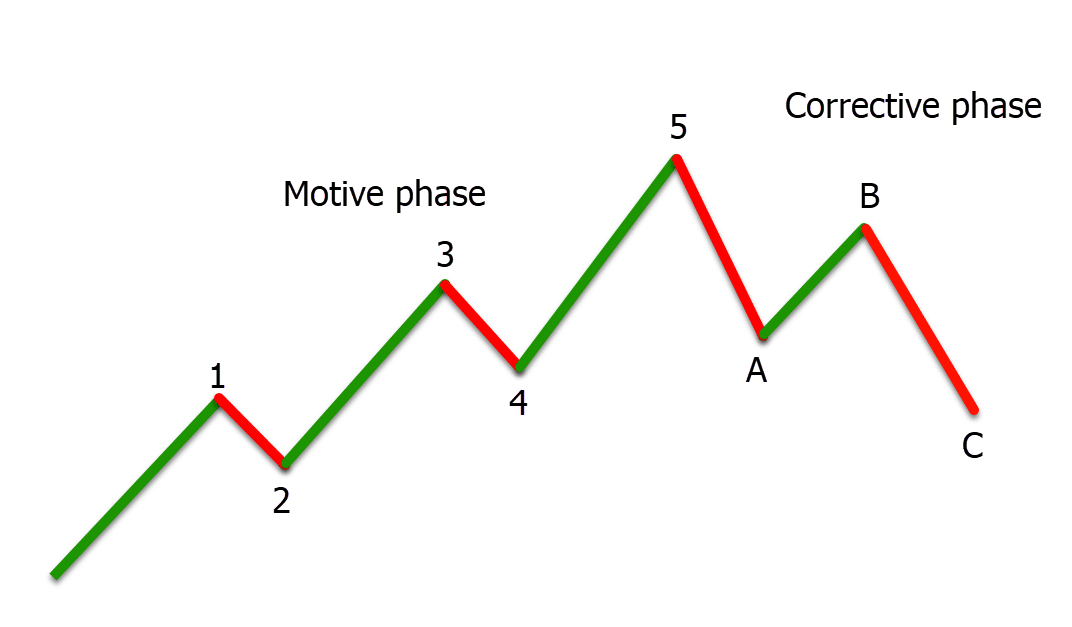
Motive Waves
When using Elliott wave in your trading, you are looking for a five-way motive phase.
The chart above shows that when the price makes this motive phase, it has three waves higher, with two short pullbacks lower.
These short pullbacks are crucial for the trend to gain momentum, but the rules must be met for the motive phase to be accurate.
Corrective Waves
The corrective phase moves into action with three moves. Instead of being numbers, these moves are referred to as A, B and C moves.
The tricky thing about the corrective phase is that it can be tough to know if the market is going through a corrective phase until it has played out and the price has made its movements.
How to Use Elliott Wave Patterns
Because the Elliott wave theory is that price moves in certain patterns, you can combine them with many other strategies and indicators.
The basic principle of the Elliott wave is that over any set time frame, the price will tend to trend in the same ways.
You can use these movements and patterns to find high probability trades and look for a trend to make its next move.
As we go through below, you can look to make and manage your trades using these Elliott wave movements.
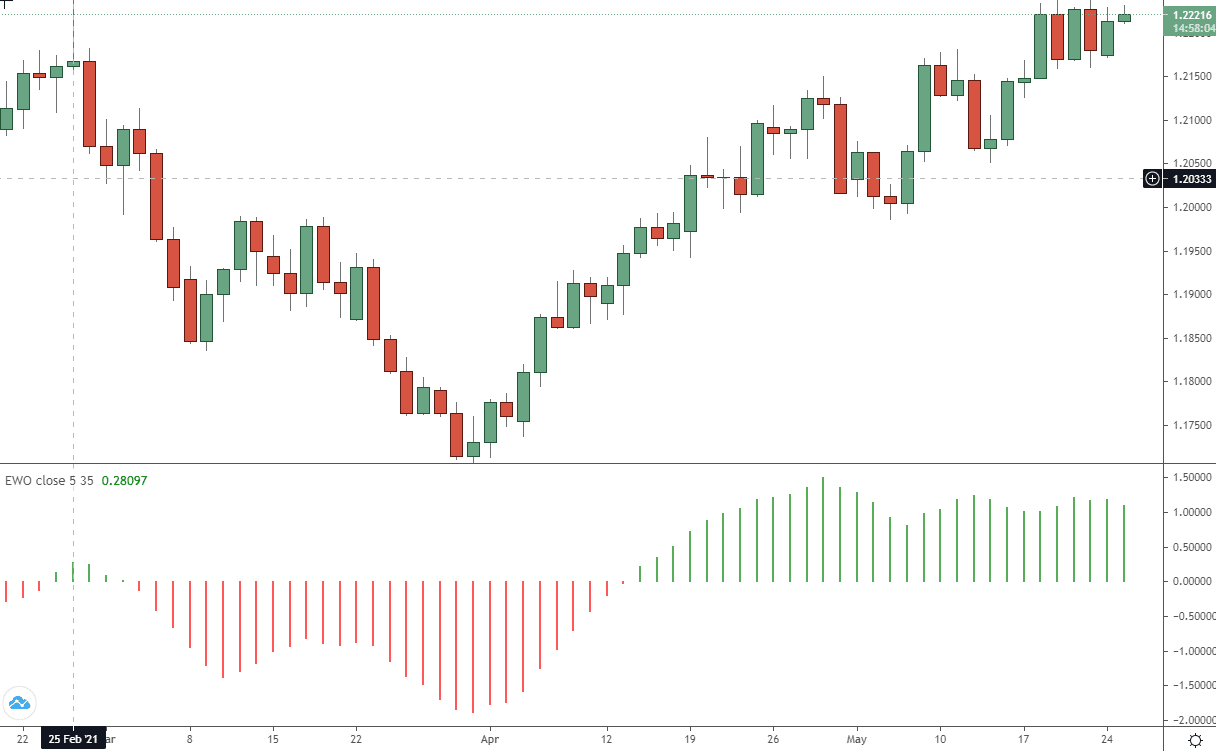
Elliott Wave Oscillators
Whilst you will often have to manually plot and mark your Elliott wave movements, you can also use an Elliott wave oscillator.
The Elliott wave oscillator uses the difference between the faster moving 5-period moving average and the slower moving 35-period moving average.
After applying the oscillator to your chart, you can use it to find trends and market movements.
When the price is trending higher, then the oscillator will show as green. This is because the faster moving 5 period moving average has been stronger than the slow-moving 35 period moving average.
When the price turns bearish, the oscillator will flip lower because the 5 moving average is moving lower compared to the 35 moving average.
See the example of this oscillator below.
Practical Elliott Wave Trading Strategies
While you can use many different strategies to find and manage your trades with Elliott wave, the simplest is to follow the patterns.
Step #1: Look For the First Three Moves
The first step to this Elliott wave trading strategy is to wait until the price has formed the first three legs of the motive phase.
After we notice these legs have successfully been formed in line with the rules, we are looking for a new trade with the trend.
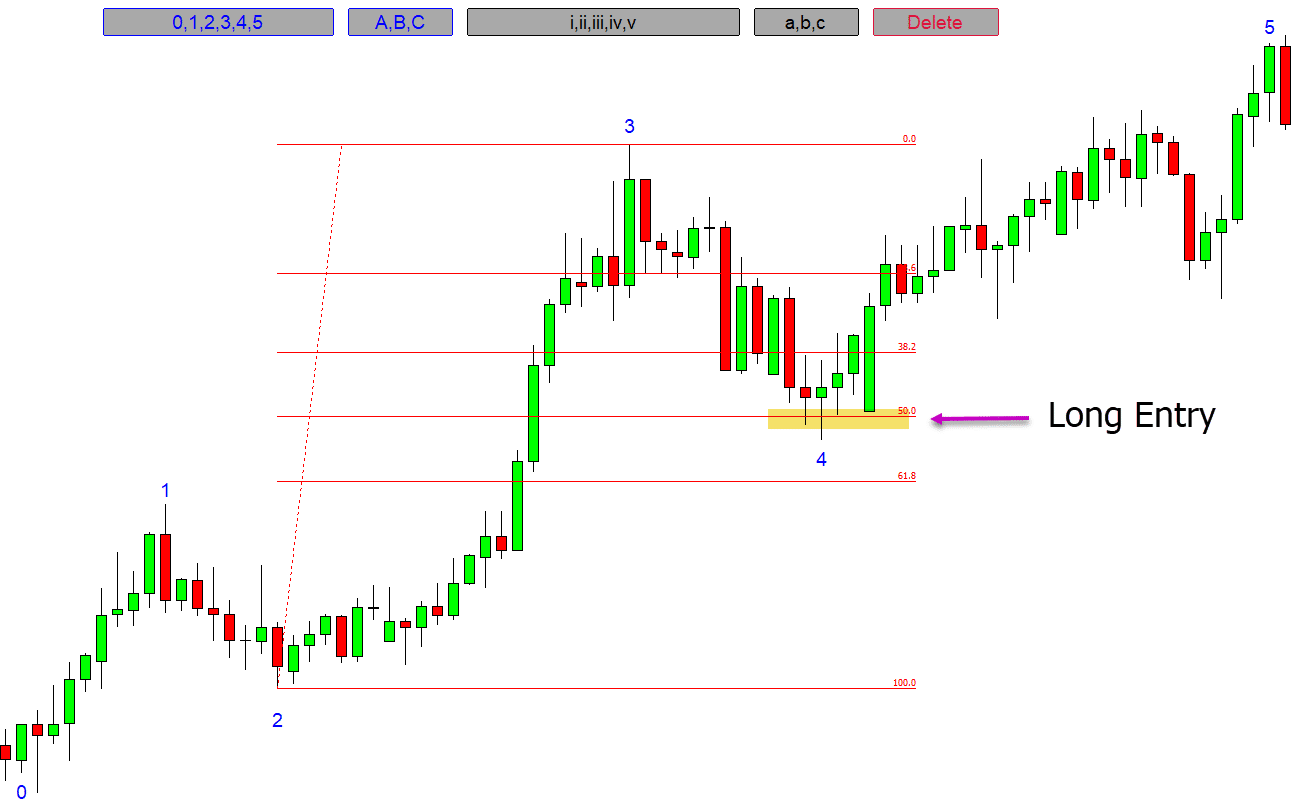
Step #2: Look for Potential Long Entries After Move Four
As price is making the fourth wave of the Elliott wave, we are looking for a new entry. In the example below, we can see that we start to look for long trades as the price is making its fourth wave lower.
As the price moves into the 50% Fibonacci level, we could start to look for long trades.
You could also fine-tune your entry with other confirmation, such as bullish candlestick patterns.
Step #3: Take Profit After Wave Five
As the price moves above the high of wave three, we could look to take our profit.
Because the Elliott wave will be invalidated if the price moves below the high of wave one, we could look to put our stop loss below this level.
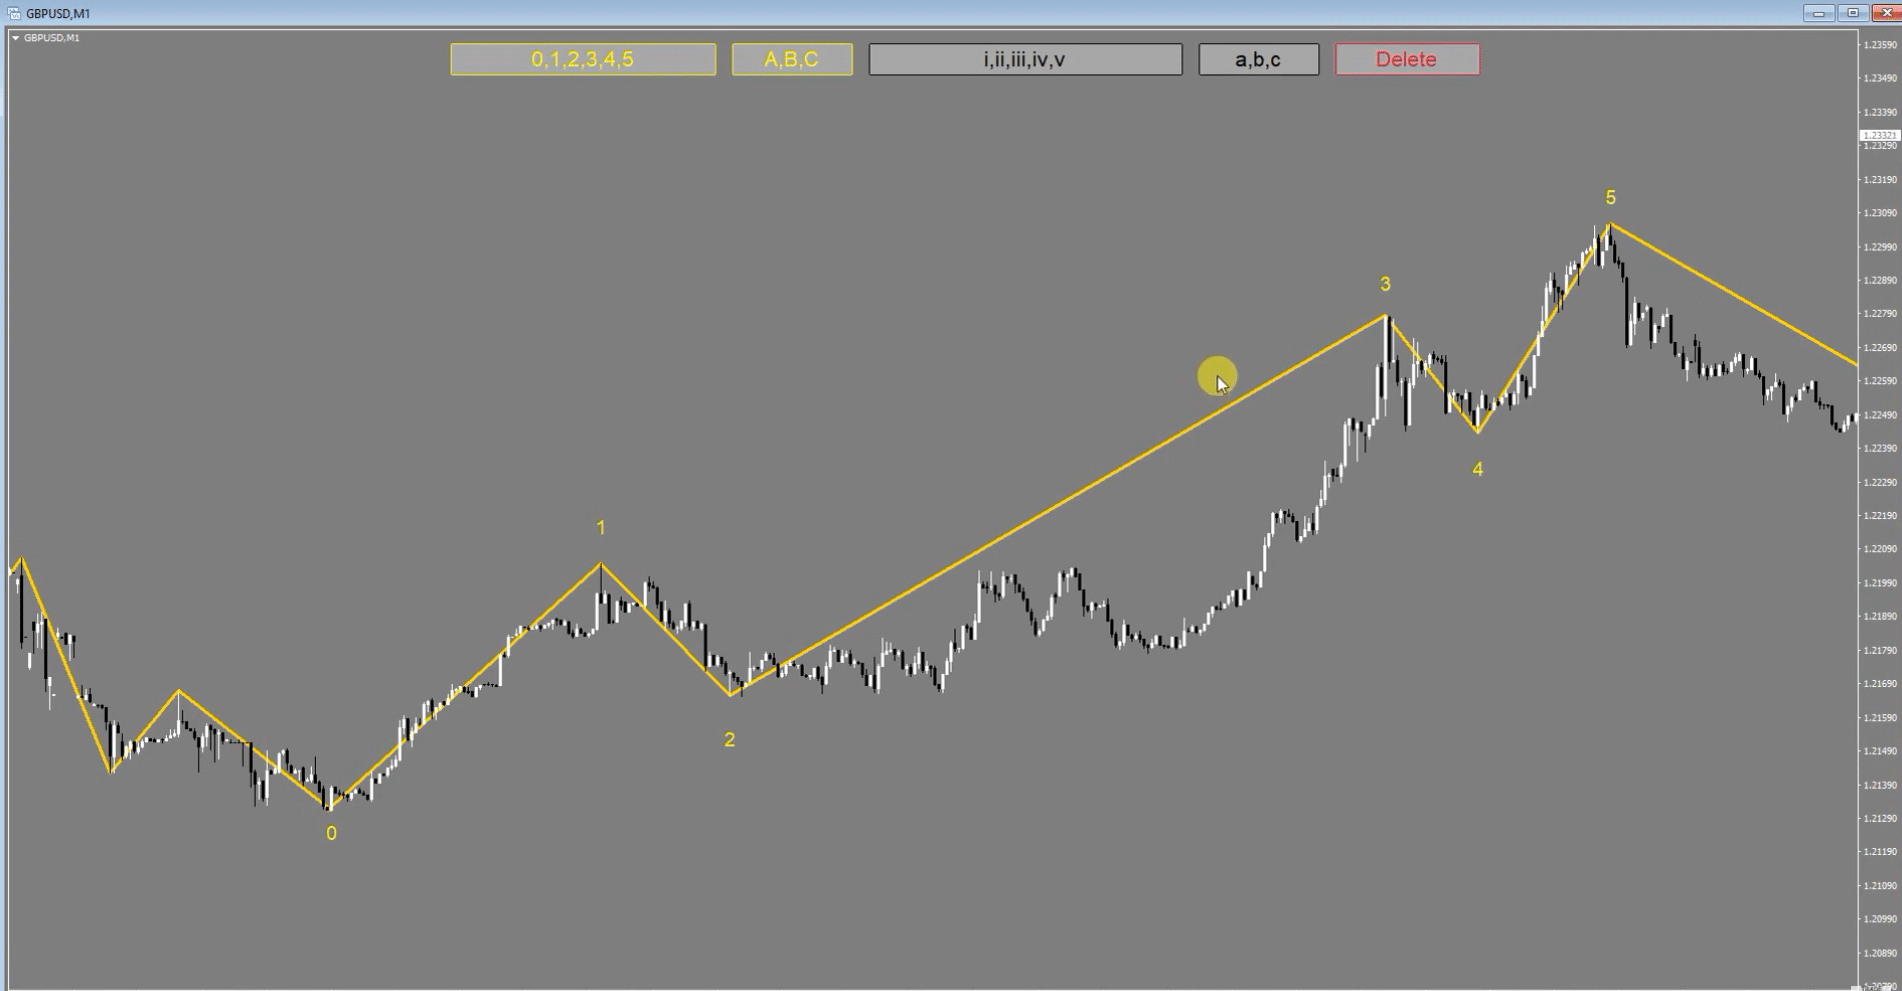
Using an Elliott Wave Indicator in MT4
Marking the Elliott wave moves on your charts can be a time-consuming process.
With this free MT4 indicator, you can quickly add all of the waves from the motive phase and the corrective phase.
This is a very easy-to-use indicator that will then let you see exactly where these waves are.
Note that this indicator does not mark the Elliott waves for you. It is designed so you can quickly market the number and letters of each phase.
NOTE: You can get your free Elliott wave patterns strategies PDF guide below.
