The hanging man is a candlestick pattern that indicates a new potential reversal lower is about to occur.
It can be used and traded on all time frames and in many different markets making it very popular for analysis.
Whilst this candlestick pattern is easy to identify, it does not form often.
In this post we look at exactly what the hanging man is, how you can identify it and how you can use it in your trading.
Table of Contents
How to Identify the Hanging Man
The hanging man is formed when the following conditions are met;
#1: Price must be in an uptrend before the hanging man forms
#2: The hanging man candle has a small body. The color or close is not important, but the body should be small.
#3: There should be little to no upper candlestick wick.
#4: There should be a large lower candlestick wick.
When a hanging man forms it indicates that buyers could be losing momentum. This could reveal a possible move back lower in the price action.
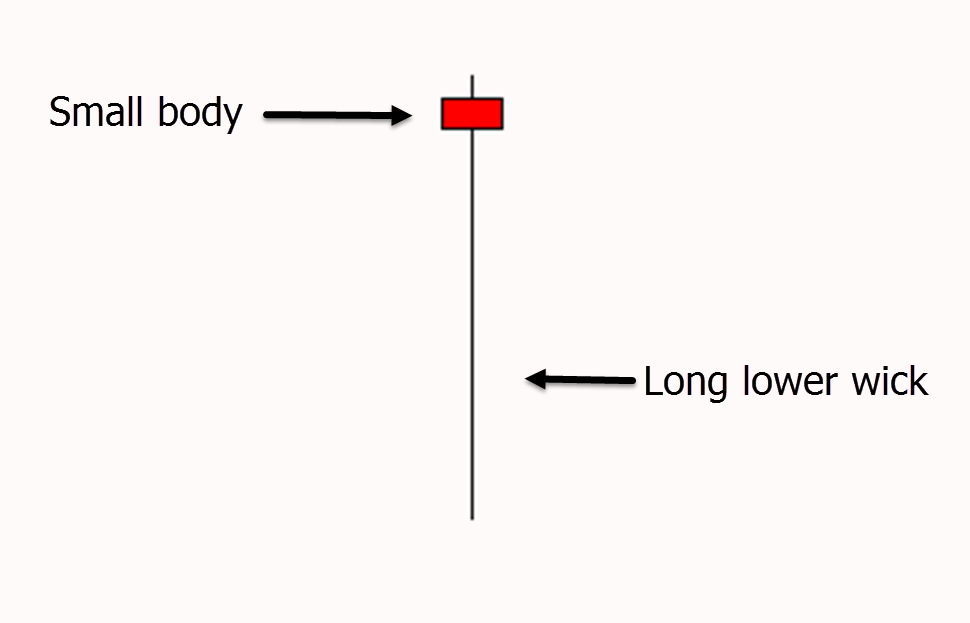
When forming the hanging man price opens before then selling lower. The buyers attempt to regain control, but are unable to make fresh highs or fully take back control. This shows the buying momentum may be running out.
Using this information you can look to enter new short trades or manage your existing long trades as we discuss below.
Example of the Hanging Man
It is both important to note where the hanging man forms along with how it forms.
This candlestick pattern needs to form at a swing high and after a move higher.
To be a valid hanging man there needs to be a long lower wick that should be at least two times the candle’s body. This shows that during the session the sellers were looking to aggressively take price lower.
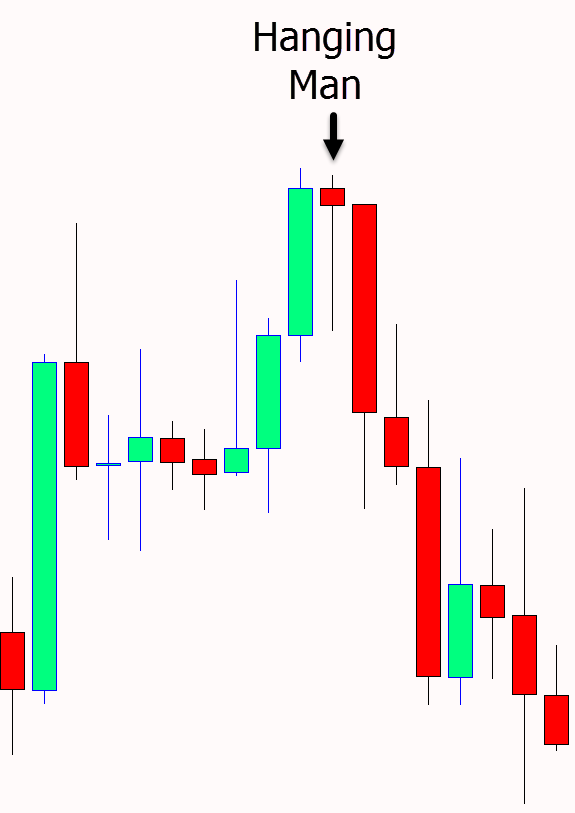
Below is an example of a hanging man.
You will note how price moved back higher at the end of the session before forming the pattern and the candle itself had a very large lower wick.
How to Trade Hanging Man Candlestick Pattern
Because it is important where the hanging man forms, it is also important the type of market it forms in as well.
Whilst this pattern needs to form at a swing high after a move higher that does not mean it needs to be traded against the trend.
Hanging man trades can be traded inline with the trend if you look to trade with the overall trend lower.
This is done by first identifying the trend lower and waiting for price to rotate higher into a resistance level.
When this occurs you are entering the trade inline with the trend and also at a key resistance level adding further confirmation to your trade.
Trade Entry
The simplest trading technique for entering the hanging man is waiting for the confirmation. This should come in the next one to three sessions after the pattern has formed.
Confirmation forms when price breaks below the low of the hanging man and the move lower begins.
Stop Loss
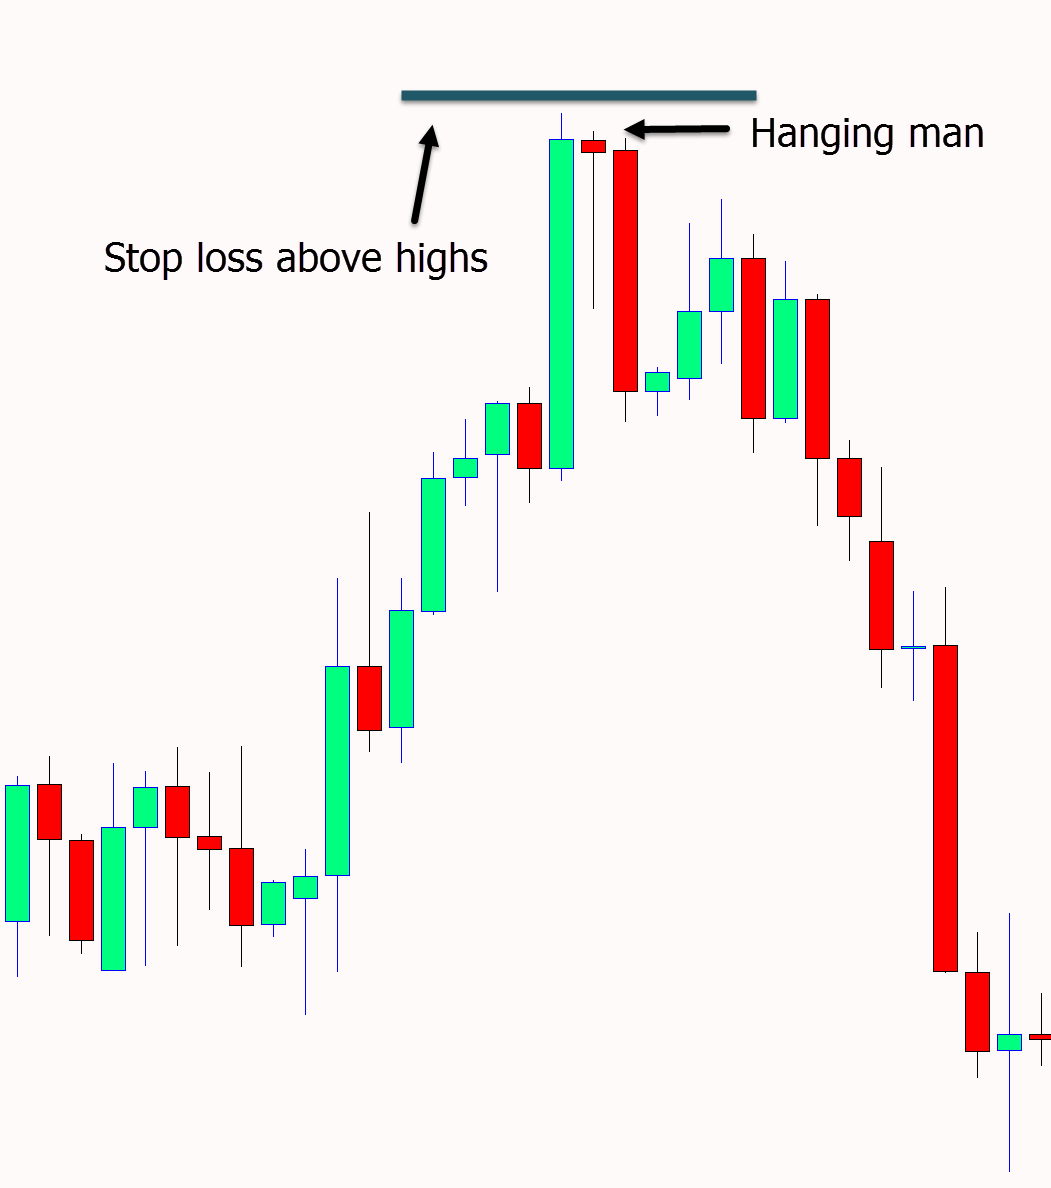
The stop loss for the hanging man candlestick pattern is often placed above the recent highs.
These are the highs that either the hanging man formed or the previous candles that had just formed.
See the chart example below for possible stop loss placement.
Using the Hanging Man for Trade Management
Individual candlestick patterns are often used by technical analysis and price action traders in their trade management.
The hanging man is no exception and can work well once you know how to identify the stronger patterns.
To use this candlestick to manage your trades you are looking to exit your long trades or tighten your stop loss.
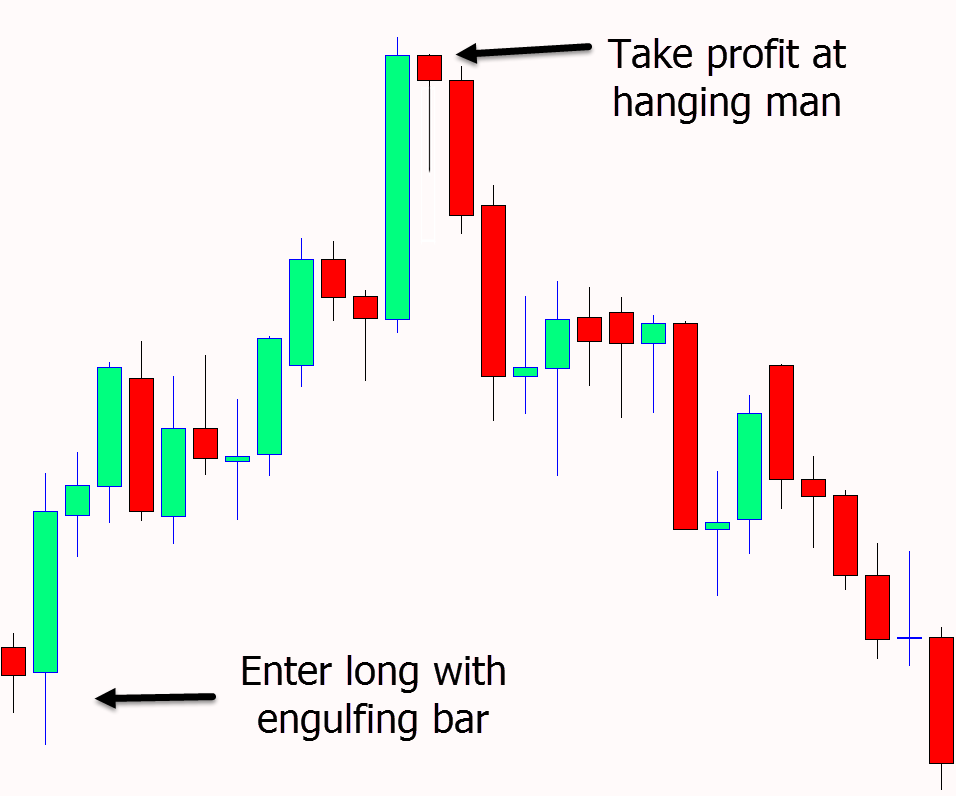
Below is an example showing how the hanging man could be used for trade management.
After taking a long trade from the bullish engulfing bar price moves higher. You could then consider taking profit and exiting or trailing your stop loss tighter.
Hanging Man and Hammer Pattern
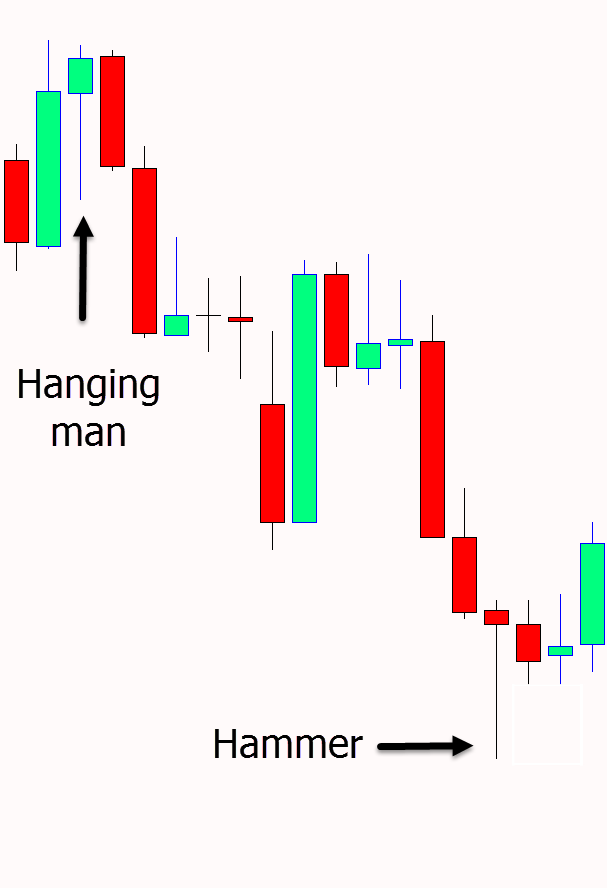
The hammer and hanging man are very similar and easy to mix up if you are not familiar with them both.
The reason for this is that they basically look like the same candlestick.
The key to recognizing the difference between the two is where they form.
Whilst both the hammer and hanging man have small bodies and long lower candlestick wicks, they form at very different positions on the chart.
The hanging man forms at the top of a move higher. This signals a potential reversal back lower.
The hammer forms after a move lower. The hammer indicates price could change from a move lower to a move back higher.
As the chart shows below, both of the candlesticks highlighted could either be a hammer or hanging man if they were flipped in where they formed.
Lastly
Whilst this pattern can be found and traded on all time frames and many markets, it is best used when combined with other analysis.
Examples of this are when lining up important areas of support / resistance, trendlines or Fibonacci retracement areas.
