Learning how to trade the stock market successfully can come with a lot of challenges. There are many different strategies and stock market terms to learn, and you will need to create an edge over the market.
Something that can help you create an edge over the market is reading and accurately analyzing stock charts.
In this post, we go through everything you need to know about stock charts and how you can start reading them to find high-probability trades.
NOTE: You can get your free how to read stock charts for beginners free PDF guide download below.
Table of Contents
What Exactly is a Stock Chart?
A stock chart shows you a visual representation of what price has done over a certain period of time. For example, you could be looking at a 15 minute stock chart that shows what the price is doing every 15 minutes, or you could be looking at a longer-term chart such as the weekly chart.
Stock charts are used to quickly get an idea of what price has done in history and what it could do in the future.
Many technical analysis and price action traders will use these sorts of charts to find patterns and trends to help them find their trades. As we discuss below, you can find many high-probability price patterns on your stock charts that can help you make trades.
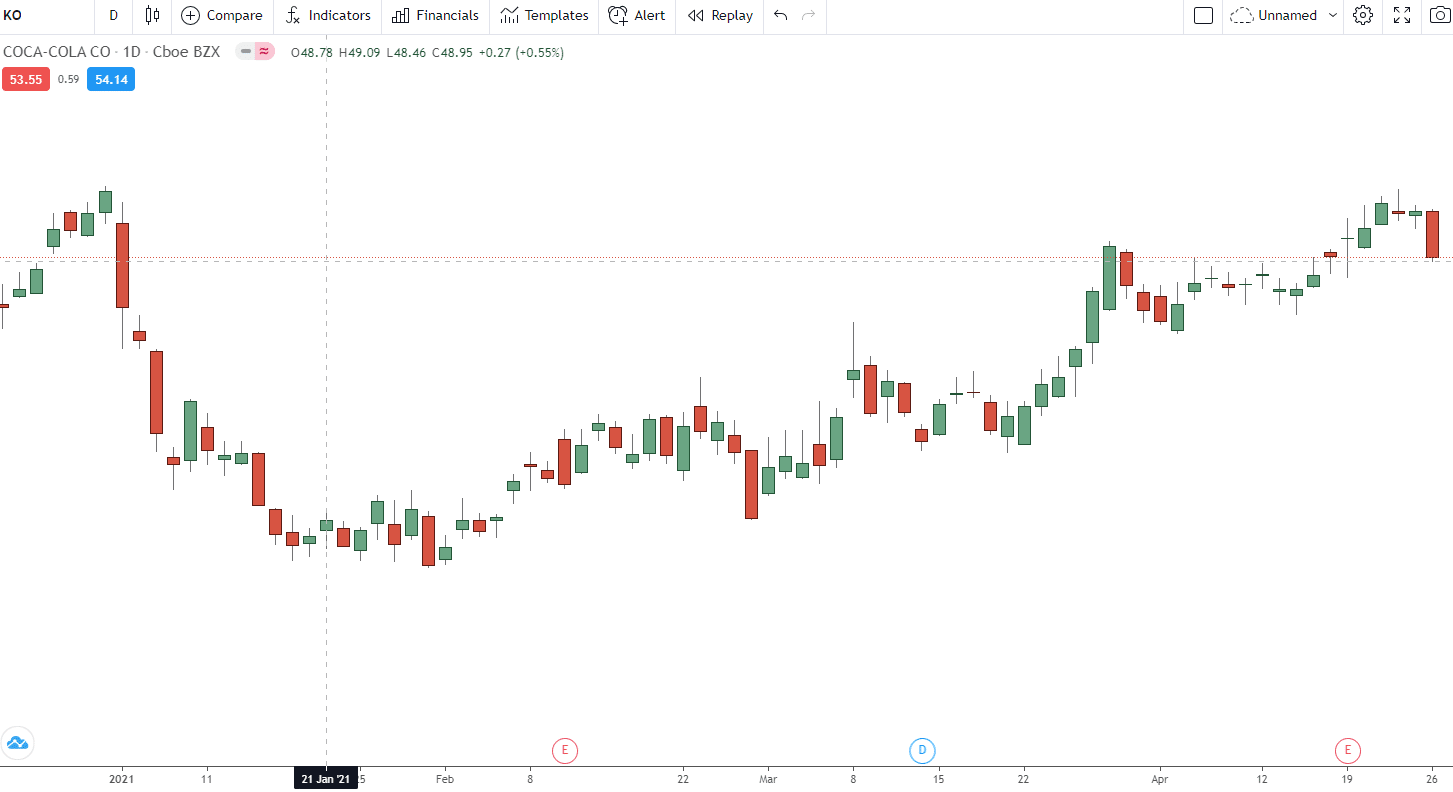
The example chart below is the daily chart of Coca Cola showing you the different price movements, higher and lower.
Choosing the Best Stock Chart
There are different charts that you can use in your stock trading that will show you different information. They each have their pros and cons.
Line Chart
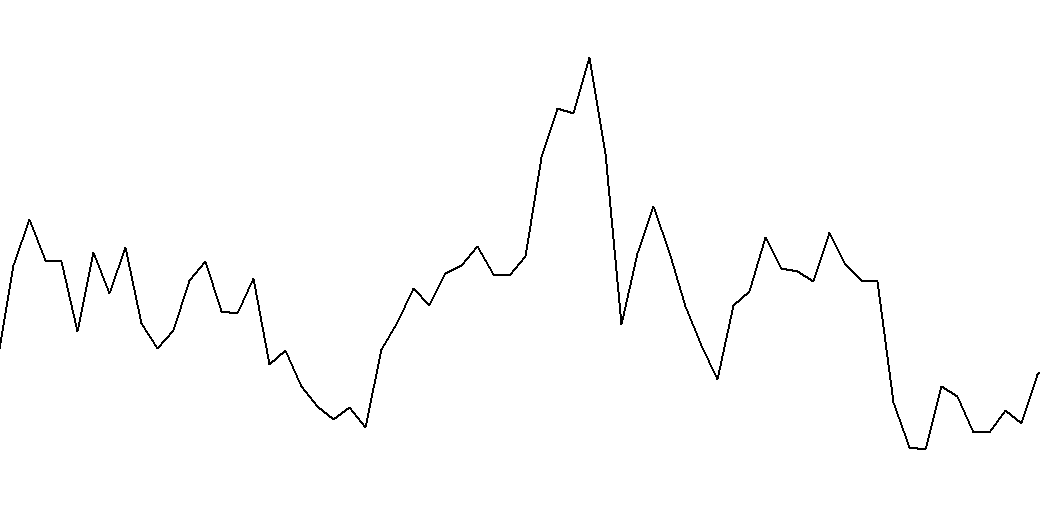
This is the simplest of all the stock market charts. This chart also has the least amount of information and is just one long line moving higher and lower.
As price moves higher or lower, the line chart will be updated and form a line.
This type of chart is good for quickly spotting potential trends and also marking support and resistance.
Bar Charts
The bar chart and candlestick chart are similar.
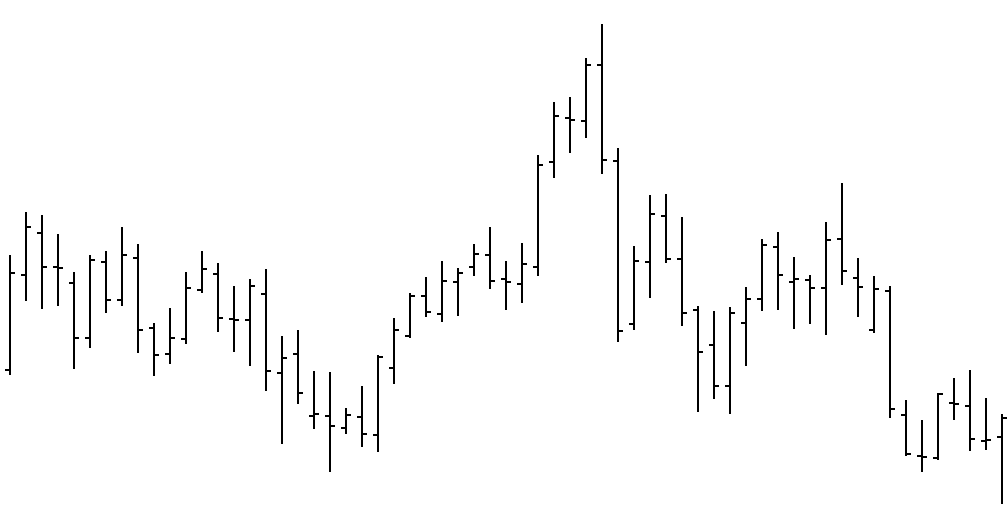
The bar chart shows you more information than a line chart as it also shows you the open, close, high, and low that price made for each session.
The example below is a bar chart. The left tip or wing shows where the price opened. The bar high and low show how far the price moved, and the tip on the right is where the price closed.
Japanese Candlestick Charts
By far the most popular of all charts is the candlestick chart.
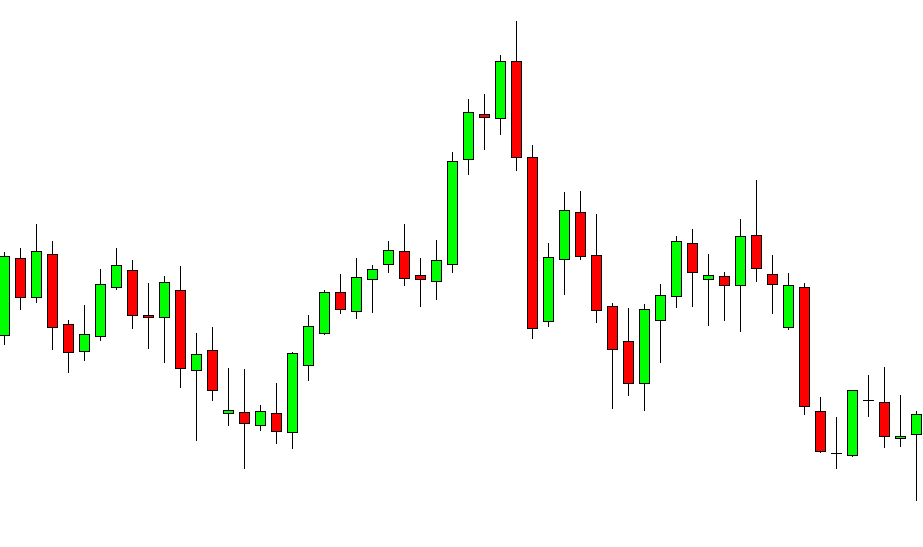
Whilst the candlestick chart shows you the same information as the bar chart, it also includes a body. You can normally change the color of the candle body to suit your own needs.
Having a candlestick body is so handy because you can quickly and easily see if the price has moved higher or lower.
In the chart below, the red candles are bearish candles where the price has moved lower. The green candles are bullish candles where the price has moved higher.
How to Read Stock Charts
After choosing the type of chart you will use, you will then want to start analyzing these charts to find and manage trades.
Some of the most popular strategies for reading stock charts include;
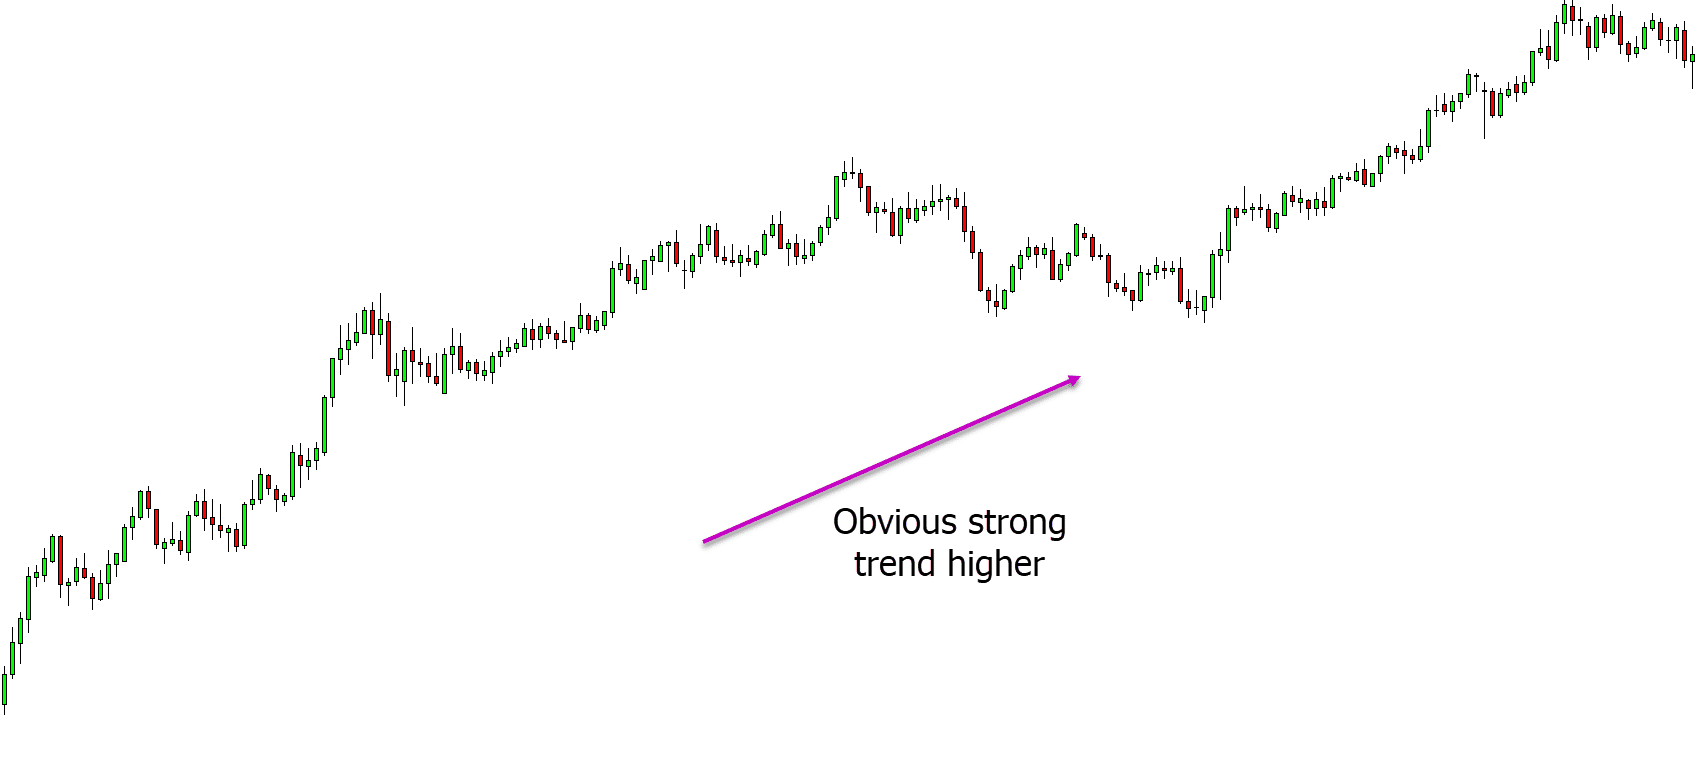
Look for the Obvious Trend
Trading with the obvious trend can often reward you with long-running winning trades that can be minimal risk.
Obvious trends will tend to run for long periods. Whilst every trend has pullbacks where price makes a move against the trend until the trend fails, it can offer high probability trades.
In the example chart below price is on a trend higher. Price makes regular moves and swings lower against the trend, but the trend overall continues moving higher.
These swings lower against the trend can often be the best spots to look for trend trading entries.
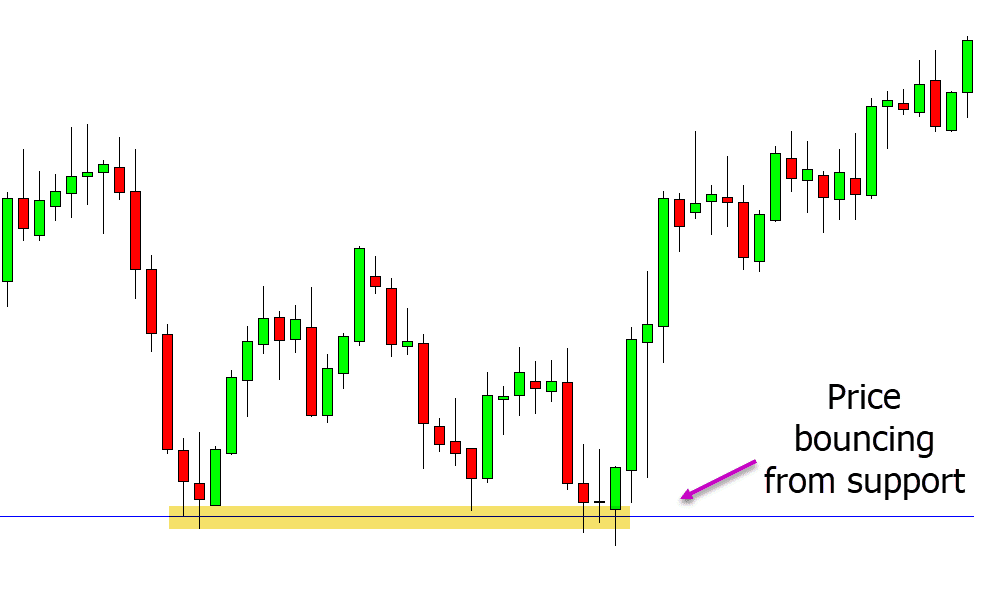
Using Support and Resistance
Support and resistance are some of the most common forms of trading across all different markets and time frames.
When using support and resistance in your trading, you can either look for the support or resistance to bounce or for a breakout.
In the example below, price moves into an important area of support. This could be a high probability area to look for long trades before the price rejects the support level and then moves back higher.
Adding Important Indicators
Stock traders will often use indicators in their chart analysis to get an idea of what price could potentially do in the future.
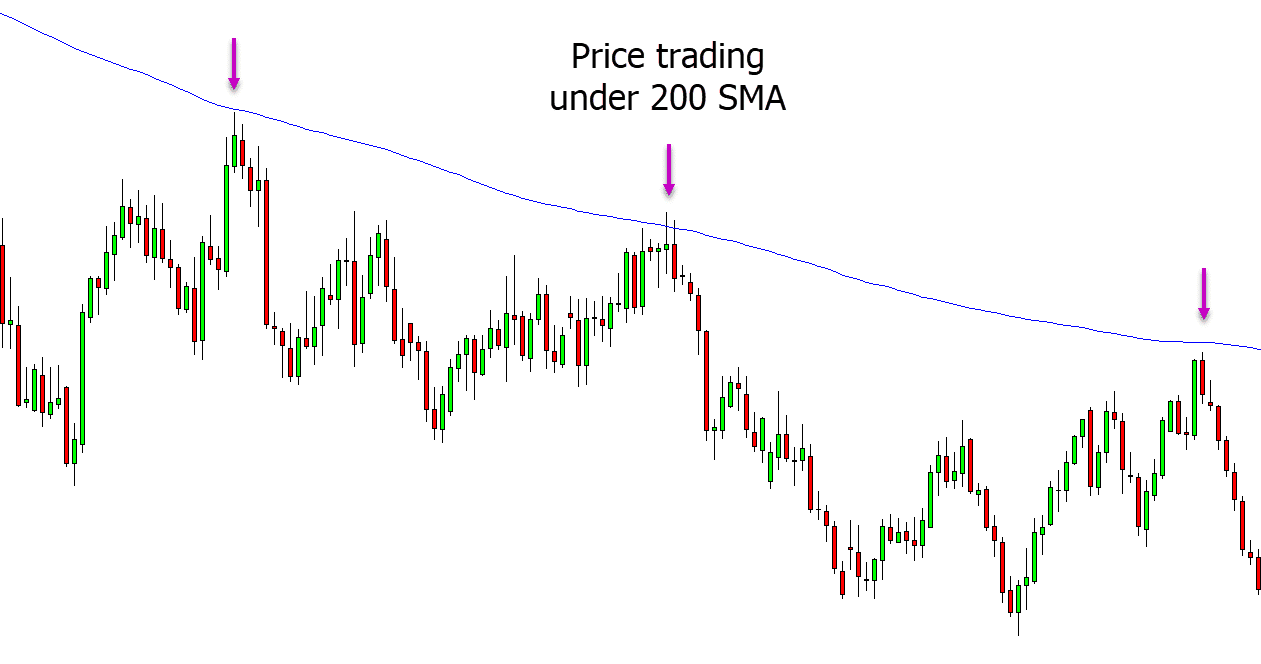
One of the most popular indicators in the stock market is the moving average and, in particular, the longer-term 200 period simple moving average.
The 200 period moving average can give you a quick indication of the overall price trend, and it can also be used as dynamic support and resistance.
In the example chart below, we can see that price continually stays below the 200 period moving average. We can also see that each time price moves higher to test this moving average, it rejects it as resistance and moves lower.
Following the Volume Information
Volume in the stock market is the amount of shares that are being traded.
Volume can be a key indicator in the stock market, and you can use it to find potential trades. You can also use it to confirm a potential trade idea you had.
When the price is moving higher with increased volume, it is normally seen as a good sign that the stock is strong and healthy. The opposite is also true when the price starts falling, and the volume is increasing. This can mean the stock is gaining momentum lower.
If the volume starts to become less and less after a large move higher or lower, it could be a sign that a potential reversal in the opposite direction could be on the cards.
Platforms That Offer the Best Stock Trading Charts and Tools
To correctly analyze stock charts and their price action, you will need a platform that has all of the tools for you to use.
When choosing your stock chart platform, you will also need to consider the type of trading you are going to be doing and the type of broker you want.
If you are looking to trade stocks as CFDs, then Metatrader offers the best charts with all the inbuilt tools you need for free.
If you are looking to physically buy and sell your shares and not use CFDs, then you will want a broker such as IG markets that offers a huge range of shares on their own platform.
