If we can accurately identify and then trade using important market levels it is obviously a huge advantage.
Just like learning how to use support and resistance levels, trend lines and other tools, the market profile indicator can help us find key levels of supply and demand. It can also help us find where major trading activity is taking place and help with finding trades and managing profits and stops.
In this post we take a look at the market profile indicator, how to use it and how you can get it for free on MT4 and MT5.
Table of Contents
What is the Market Profile Indicator?
The market profile indicator is an indicator that uses accurate tick data to add a histogram image on your chart. Below is an image showing the Point Zero market profile indicator discussed a little further below;
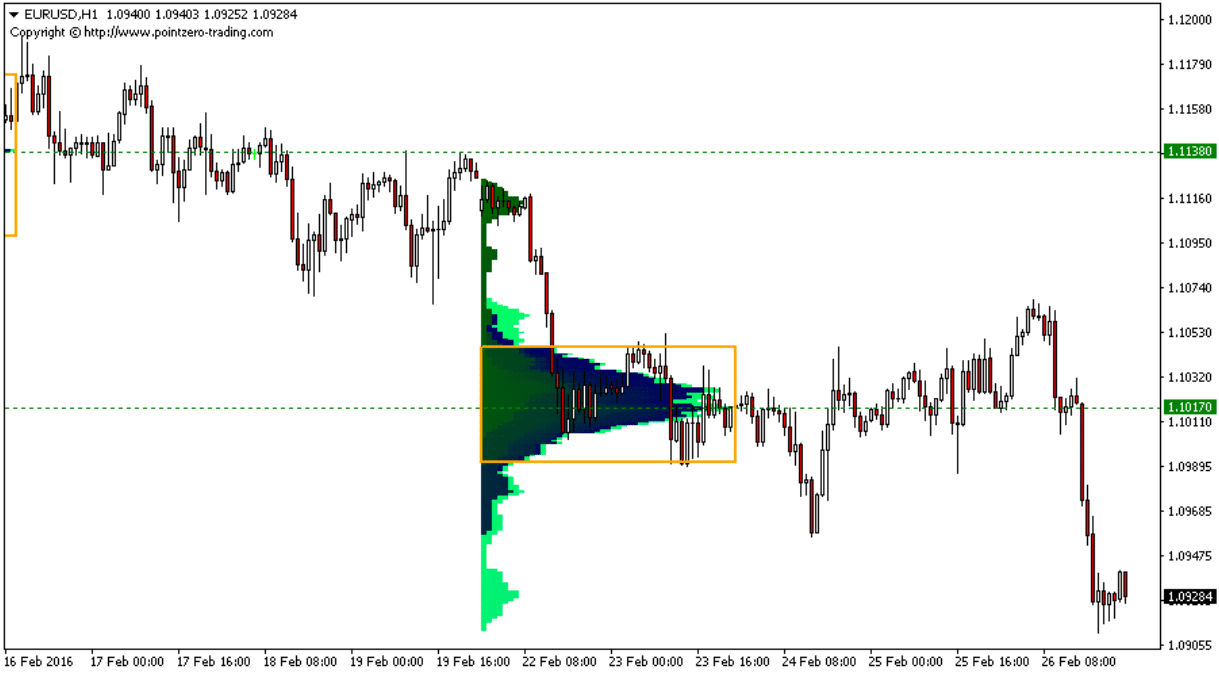
This chart shows you support and resistance levels, important price action zones and where price is being heavily traded.
The indicator is created using information from volume, elapsed time and the number of ticks at certain levels for a given period of time.
With this information you will be able to find the most heavily traded price action levels. Combined with other tools and indicators like the pivot point indicator you will then be able to spot and enter quality trades and manage your trades with these levels.
How to Use the Market Profile Indicator
One of the most common uses of this indicator is using the ‘value area’.
As the markets progress throughout a session price will move up and down with orders to buy and sell.
As the indicator carries out it calculations using time, volume and tick data, a value area will be created.
This value area is the mid point of the current supply and demand levels. Between the value area you will also be represented with two extremes; the upper and lower or the market profile.
Often traders will use the market profile in conjunction with other tools like price action analysis to trade between the two extremes. For example; in a ranging market trading from the lower extreme to the higher extreme.
NOTE: You may like the CCI indicator.
Market Profile Indicator MT4
Note: Don’t know how to install and use indicators? Read How to Download, Install and Use MT4 and MT5 Indicators
EarnForex Market Profile Indicator MT4
This is one of the better market profile indicators and can be used from time frames 1 minute through to the daily chart.
As with most trading indicators; whilst the smaller time frames will give you a higher level of precision and also smaller stops, the higher time frames offer more stability.
No other indicators are needed with this indicator and it is best used with a raw price action chart.
The other nice thing about this indicator is that you can get the free download for either MT4 or MT5.
The EarnForex indicator comes with a lot of different parameters you can change and adjust to your liking with the main inputs;
- Session: Default = Daily. Your chosen trading session Daily, Weekly, Monthly, or Intraday.
- StartFromDate: Default = __DATE__. If StartFromCurrentSession is false, then the indicator will start drawing profiles from this date. It draws to the past. For example, if you set it 2018-01-20 and SessionsToCount is 2, then it will draw the profiles for 2018-01-20 and 2018-01-19.
- StartFromCurrentSession: default = true. If set to true, then the indicator starts drawing from today.
- SessionsToCount: default = 2. How many trading sessions to draw the market profiles.
Get the EarnForex Market Profile Indicator MT4
Market Profile Indicators MT5
PointZero Market Profile 2.0
The Point Zero market profile 2.0 indicator provides you with greater insight into the market allowing you to see the key price levels, the major market activity and the value areas.
With this indicator you will be able to;
- Understand dynamics and flow of the market
- Automatic period and time frame selection
- Identify the important value areas and trading zones
- You can use it in all market conditions
- Can be used in conjunction with any trading strategy
- Uses two easy to identify color schemes
This is an easy to use indicator and you can get the free download below.
Get the PointZero Market Profile 2.0 MT5 Indicator
Market Profile Indicator at MQL5
This MQL5 indicator is based on simple raw price movement and history and does not require any further indicators.

When using this indicator you will be able to see on your chart the time distribution of the price, price area and control value for the days trading session.
The author of this indicator cleverly created different colors for the different trading sessions. Green indicates the Asian session, Blue indicates the European session, whilst violet indicates the American session.
You are given the following Input parameters:
- Start Date: Test starting date
- Last Day Start: If set to true, it is drawn until the last day (Start Date will be ignored
- Count Profile: The number profiles you wish to be drawn
Get the Market Profile Indicator at MQL5
Lastly
Whilst not as straightforward as a simple moving average or the Fibonacci retracement tool, the market profile indicator can be incredibly insightful.
Being able to know where the big trading activity is taking place and where intraday market extreme and value points are can be a real advantage.
This indicator is best used in combination with other strategies and tools like your MACD, moving averages, technical and price action analysis and ATR.
