
In Forex and stock trading, volume is the number of shares or units that have been traded over a set time period, for example; a daily trading session.
Volume plays a crucial role in deciding the movement of the price of an asset and it can help us gauge the strength or weakness of a market.
In this post we go through exactly what the volume profile indicator is, how to use it in the Forex and stock markets and how to get a free download for the MT4 and MT5 platforms.
Table of Contents
What is the Volume Profile Indicator?
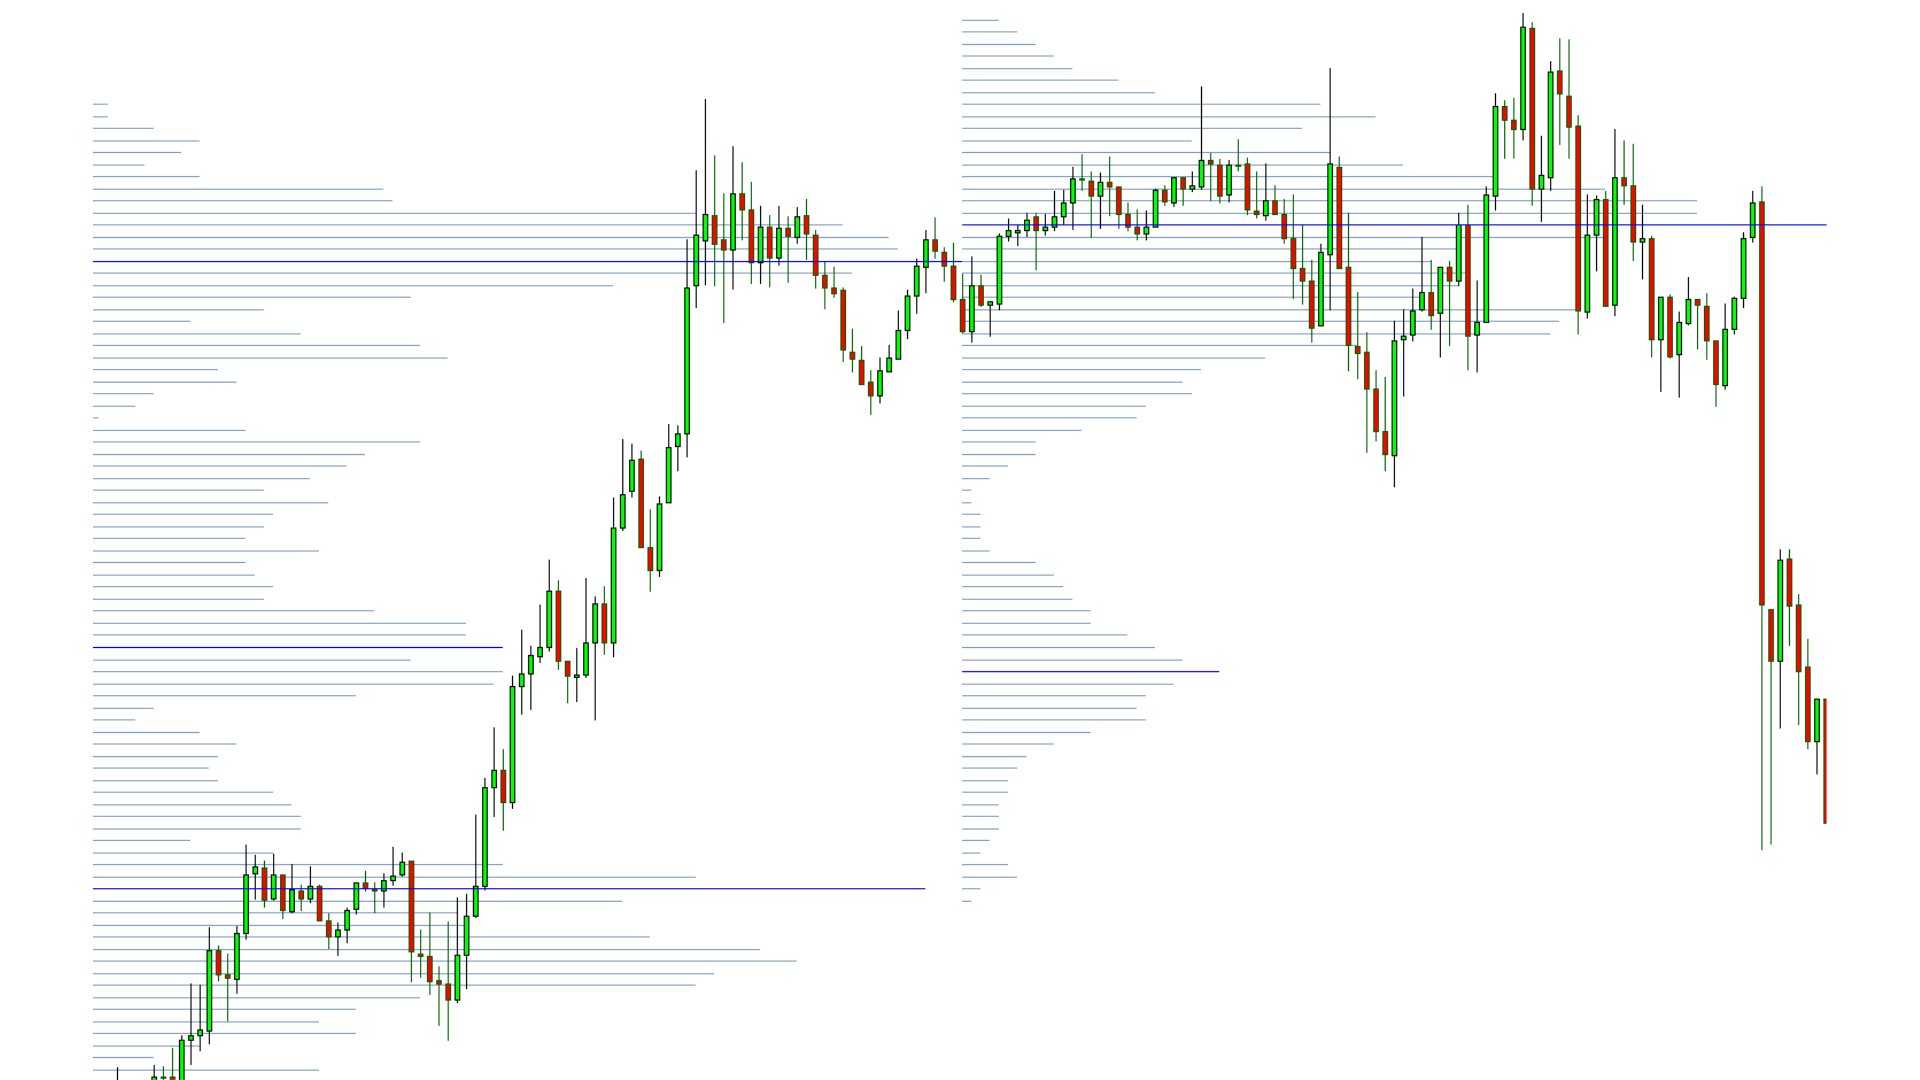
The volume profile indicator is a charting tool that displays an asset’s trading activity over a specified period at a specific price level.
This indicator plots a histogram on your chart and reveals the dominant and significant price levels based on their volume.
The volume profile indicator takes the total volume of an asset traded at a certain price level during a specific period and divides it by the total buy or sell volume.
The information obtained by this indicator is easily visible on your charts and makes it easier for you to make some key trading decisions.
NOTE: You may also like the market profile indicator.
How to Use the Volume Profile Indicator in Your Trading Strategy
There are two very popular ways you can use the volume profile indicator.
Analyze the Trend with the Volume Profile Indicator
The volume profile allows you to analyze the market trend and also potential areas where price is about to make a reversal.
Volume is what the markets need to make their next move. Volume shows us whether the interest of making trades in the Forex pair or other asset is increasing or decreasing.
This is also the reason why you will very often see a large increase in the amount of volume just before the markets make a reversal or change trend direction.
This is something you can take note of and when you see a large spike in volume begin to look for and confirm reversal trades.
Trade the Volume Area High and Low
Another volume profile strategy that works well is identifying the important points where the market is showing increased and decreased amounts of volume.
These areas can help you find value areas to make trades and also where to take profit.
For example; if you have been in a long running trend trade and you notice that volume is beginning to spike, you could begin to look at managing your trade by taking profit or trailing your stop loss.
Volume Indicator Chart Example
Similar to other charting tools, the volume profile indicator has numerous uses.
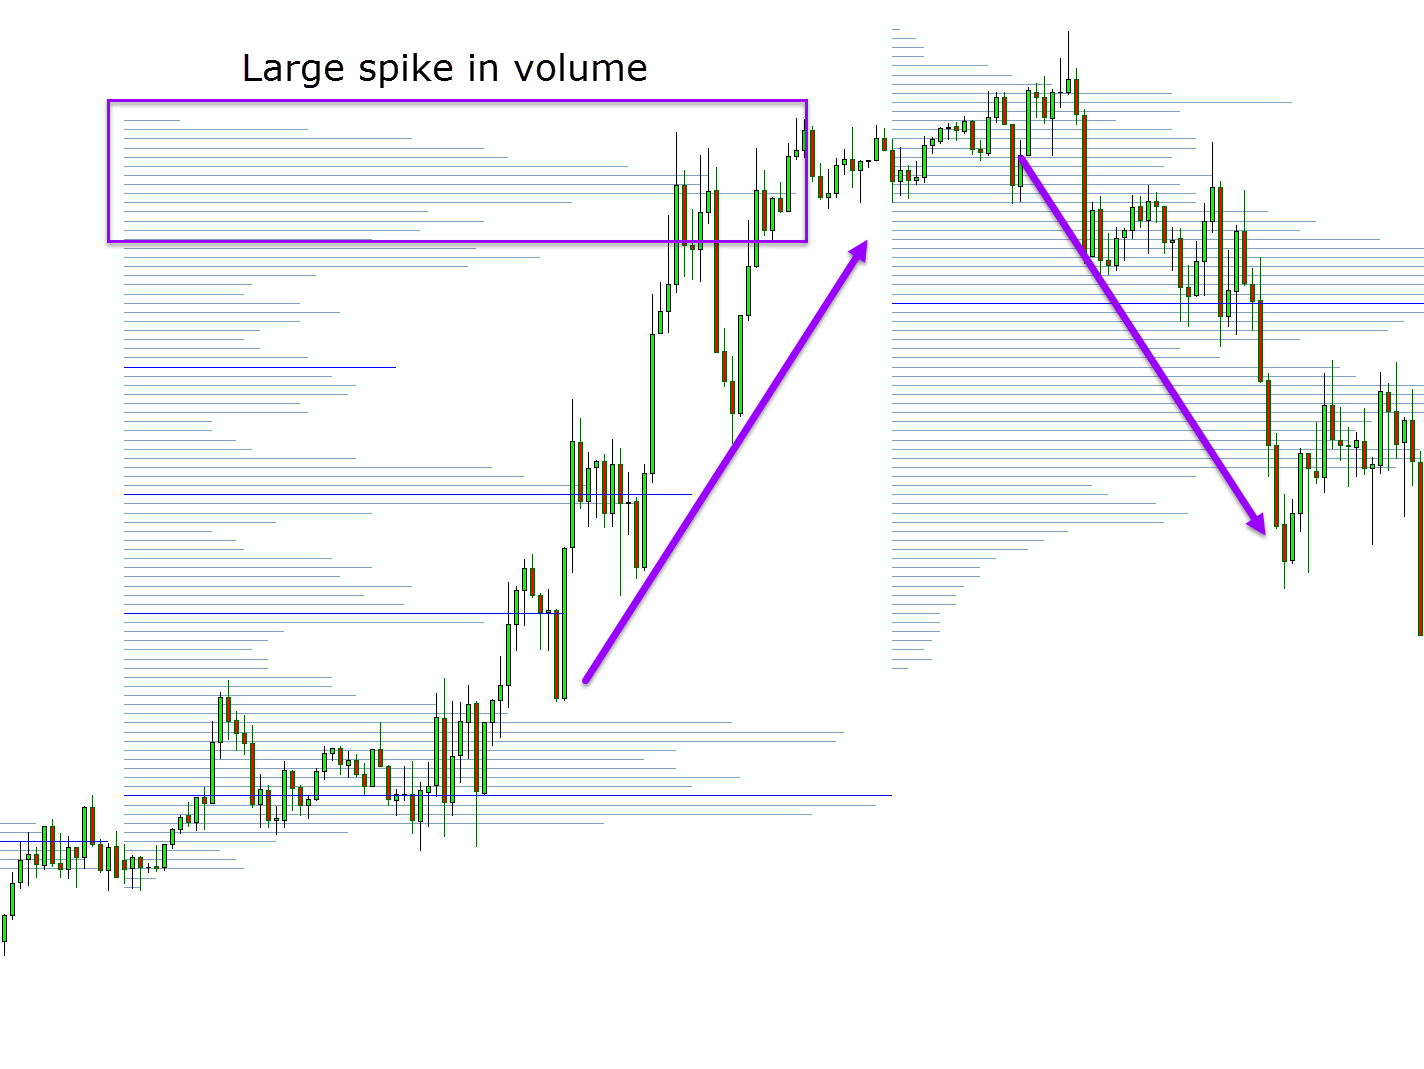
The chart below has an example of how you could look to use this indicator.
This example shows how you may have entered a long trade down at the swing low.
After price makes a nice move higher and gives you a healthy profit you begin to see a large spike in volume.
Because you know that large spikes in volume often occur at reversal points, you could use this information to either take some profit off the table, or trail your stop loss before price then moves back lower with a reversal.
Volume Indicator for MT5 Free Download
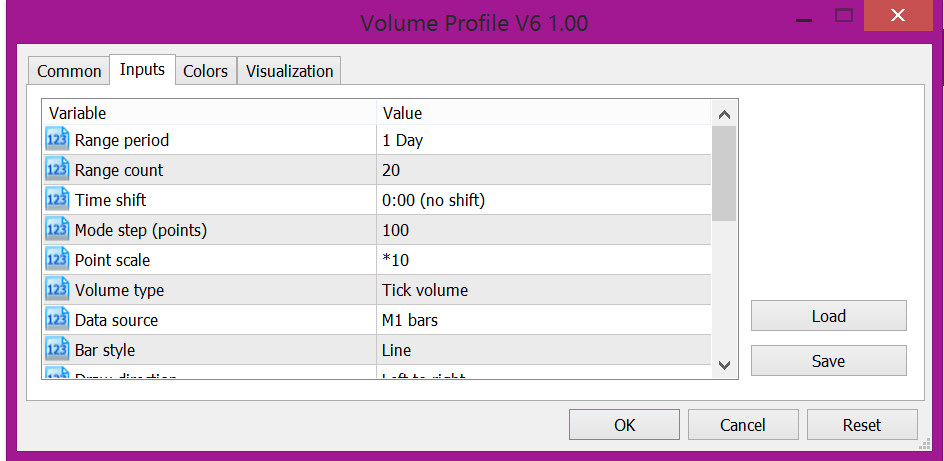
The Volume Profile + Range v6.0 is an indicator for MT5 trading platform users.
This indicator displays on your MT5 platform as a histogram.
It comes with a lot of different features, is very easy to set up and is free to download and use.
Get your volume profile indicator for MT5 here.
Volume Profile Indicator for MT4 Free Download
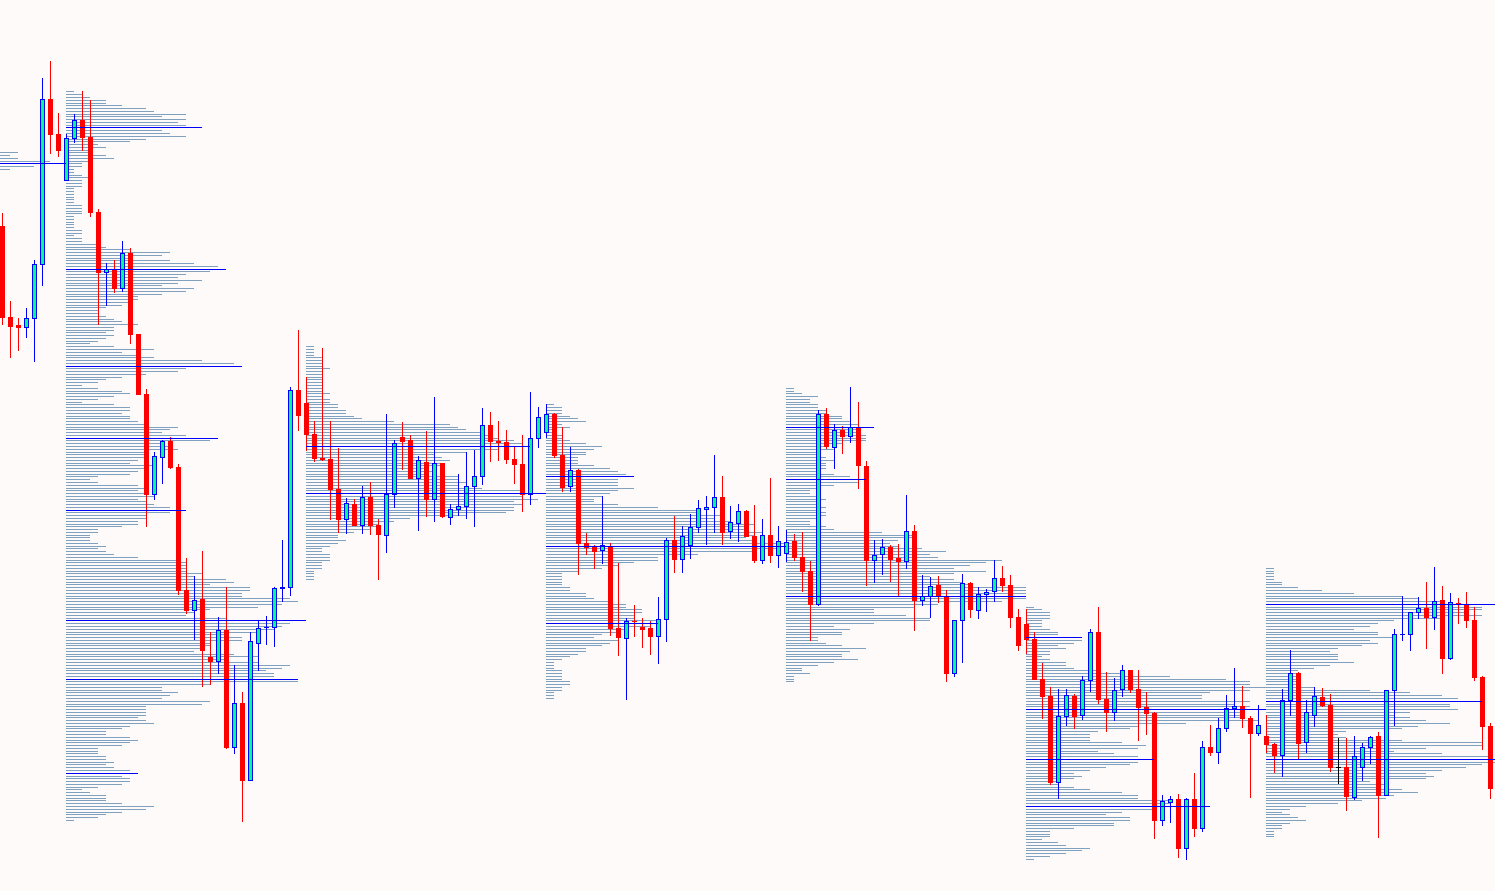
The KT Volume Profile Indicator is available for free to both MT4 and MT5 trading platform users.
This indicator displays the volume accumulation data as a histogram on the y-axis.
You can use this indicator on all your time frames and markets and it is incredibly easy to download and start using.
Get your volume profile indicator for MT4 here.
Lastly
Volume profile is an important technical analysis tool used by traders all over the world.
The reason it is so popular is because it is incredibly easy to use and can help you quickly identify if there is an increase or decrease in the amount of buying and selling.
This can help you both make and manage your trades and also identify the ‘hot spots’ in the market.
