Are you thinking about trading the 1 minute chart and need the best indicators?
In this post we go through the best indicators and strategies you can start using on the 1 minute chart in your own trading today.
Table of Contents
Best Indicators for the 1 Minute Chart
If you are looking to trade the 1 minute chart, then you better be on your toes.
The 1 minute chart moves at lightning pace and you will need to be prepared to move quickly. You will need to have full knowledge of all of your different order types and be prepared to quickly cut your trades or make readjustments.
With that in mind, here are the best and simplest indicators, tools and strategies for the 1 minute time frame.
Moving Averages
Moving averages and in particular the exponential moving average (EMA) are one of the most popular indicators for a reason.
You can use EMA’s to find trends, dynamic support and resistance as well as gauge momentum.
You can use just one moving average or combine multiple moving averages to give you better indications.
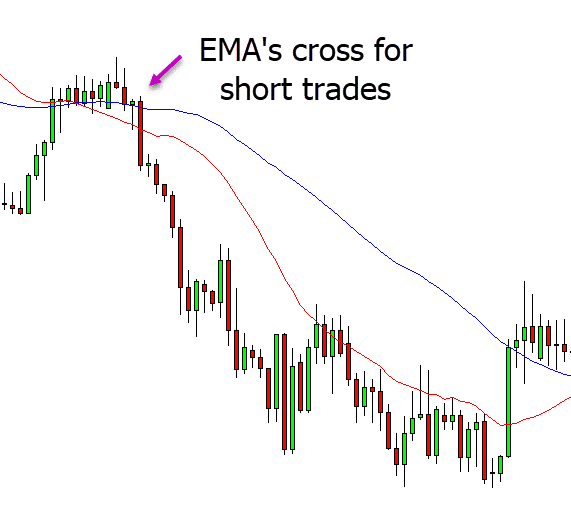
Most traders find the best use of moving averages is when two are used, one fast moving and one slow moving. An example of this is below. With this example there is a 21 period and 50 period EMA added to the chart.
The 21 period EMA moves and reacts faster to the price action compared to the slower moving 50 period.
As you can see in the example below, the 21 period EMA crosses below the 50 period EMA indicating a trend lower. We then know to start looking for short trades. As the EMA’s widen we know that the trend lower is getting stronger and we continue to look for short trades with the trend.
Support and Resistance
This is one of the simplest trading strategies you can use on the 1 minute time frame that will find you a lot of trades.
If you use this strategy correctly you will also find a lot of high probability trades that will offer you many winning setups.
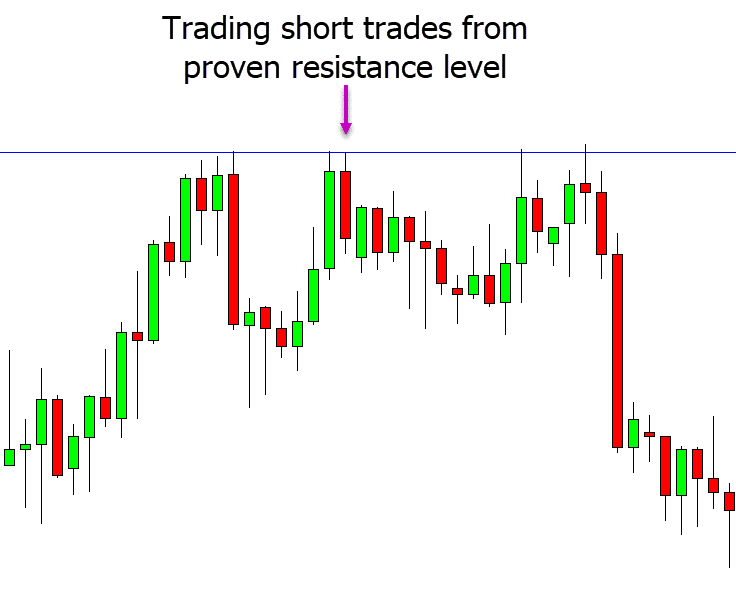
The reason this is such as simple strategy is because you are simply looking for key areas of support or resistance. These support or resistance areas can be within a range like the example below, against the trend or with the trend.
When you have found these key areas you are then looking to trade the ‘bounce’ away from the support or resistance.
Trade With Trendlines
Using trendlines are another incredibly simple, but also popular way to trade intraday charts such as the 1 minute time frame.
Trendlines can be used to make both long and short trades and they can often lead to large running winning trades.
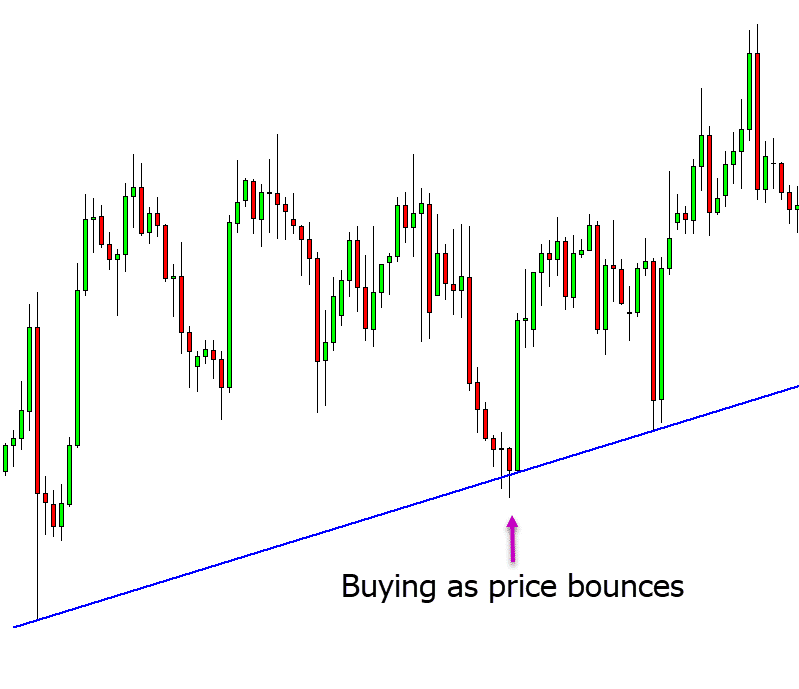
In the example below price has formed a trendline higher.
As price pulls back into the trendline support area we are then looking to trade the bounce and profit as price moves back higher.
Fibonacci Tool
The Fibonacci tool is great for finding reversal trades and you can use it on your 1 minute charts to find high quality trades.
You can use the Fibonacci indicator to make both long and short trades and you will often be able to find trades with small stop loss levels and high reward targets.
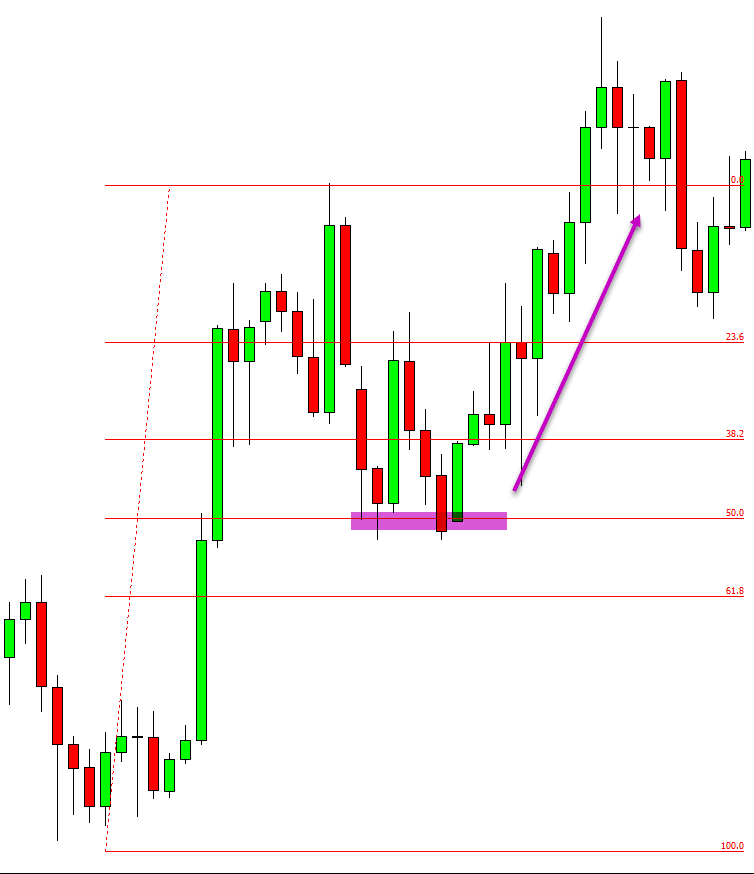
In the example below price is in a trend higher. Price then pulls back into the 50% Fibonacci level. At this level we can look to make long trades and for the trend higher to continue.
Lastly on Using Indicators on the 1 Minute Charts
Whilst there are many indicators and strategies you can use on the 1 minute charts, you will often find the best strategies are the simplest.
This is even more the case on the 1 minute charts where you don’t have much time to think and carry out your trades. With so little time to act you need a strategy that is simple and high probability that will allow you to get in out of the markets quickly and profitably.
It is very important, especially on small time frames like the one minute time frame that you test any new strategies on free demo / virtual charts risking no real money. You don’t want to be risking real money before you know that your chosen strategy works and makes you profits.
