Trading in the financial markets can often feel like running through a minefield. The number of variables that influence the price of securities can be overwhelming, and even the most experienced traders need help to succeed.
Thankfully, several tools are known as indicators that can provide traders with the much-needed information they need to make the best trading decisions possible.
This post goes through one type of indicator known as a trend strength indicator. The trend strength indicator can help you identify which way price is trending and how strong the current trend is.
NOTE: Want a full list of some of the best free MT4 and MT5 indicators you can use in your trading? You can get them below.
Table of Contents
What is a Trend?
A trend can be defined as the general direction that something is developing or changing.
A trend refers to the overall direction that a security, asset class, or market is moving in the financial markets.
Trends can be difficult to see over shorter time frames. To get an idea of where a security is trending, you need to look further back. Let’s look at the S&P 500 over the last year (2020-2021). We can see in the chart below that since March 2020; the S&P 500 has been trending up.
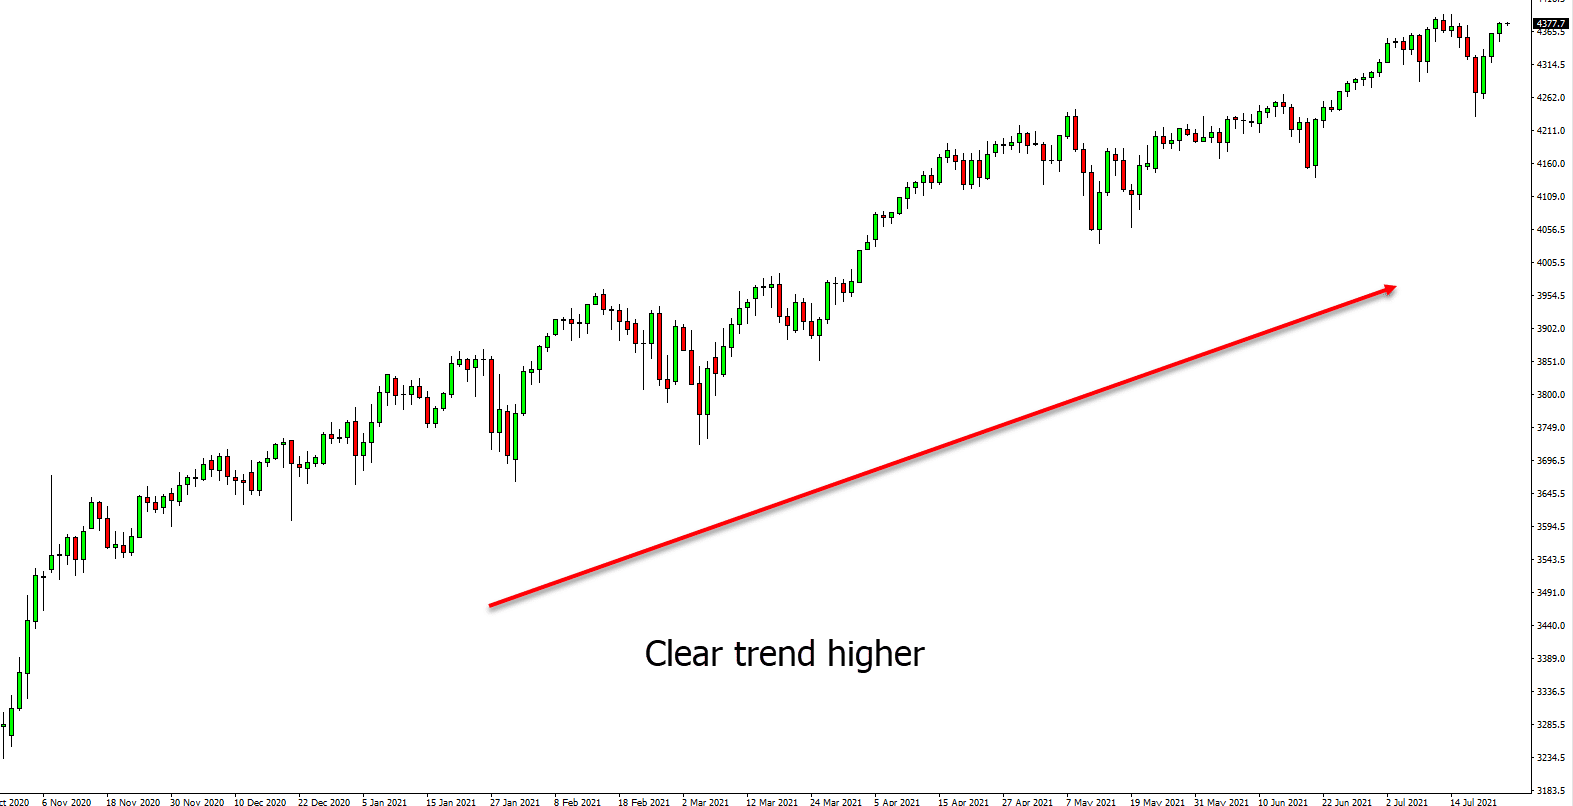
Whilst there are small dips throughout the chart, the overall direction of the graph is upwards.
Securities and markets can trend in one of three ways; up, down, or sideways.
The forces of supply and demand dictate the direction of these trends. If there is more demand than there is supply, the security will trend upwards. If there is more supply than demand, the stock will trend downwards.
A sideways trend or range is caused by the two forces of supply and demand being equal.
NOTE: You may also be interested in the Vortex indicator.
Indicators Commonly Used for Trend Trading
Indicators will be a regular feature of your trading, regardless of whether you trade in forex, stocks, commodities, or cryptocurrencies. They are mathematical formulas observed as lines on a price chart. These indicators provide traders with specific information about securities that can be used to inform their trading and increase their probability of success.
These indicators are easy to access online. Many of these indicators are built into numerous online platforms like MT4 and MT5 for you to use for free. The three most common indicators used for trend trading are moving averages, MACD, and the Relative Strength Index (RSI).
Moving Averages
Moving averages are technical tools that help you identify the average price over a period of time by smoothing out price data and creating a constantly updated average price.
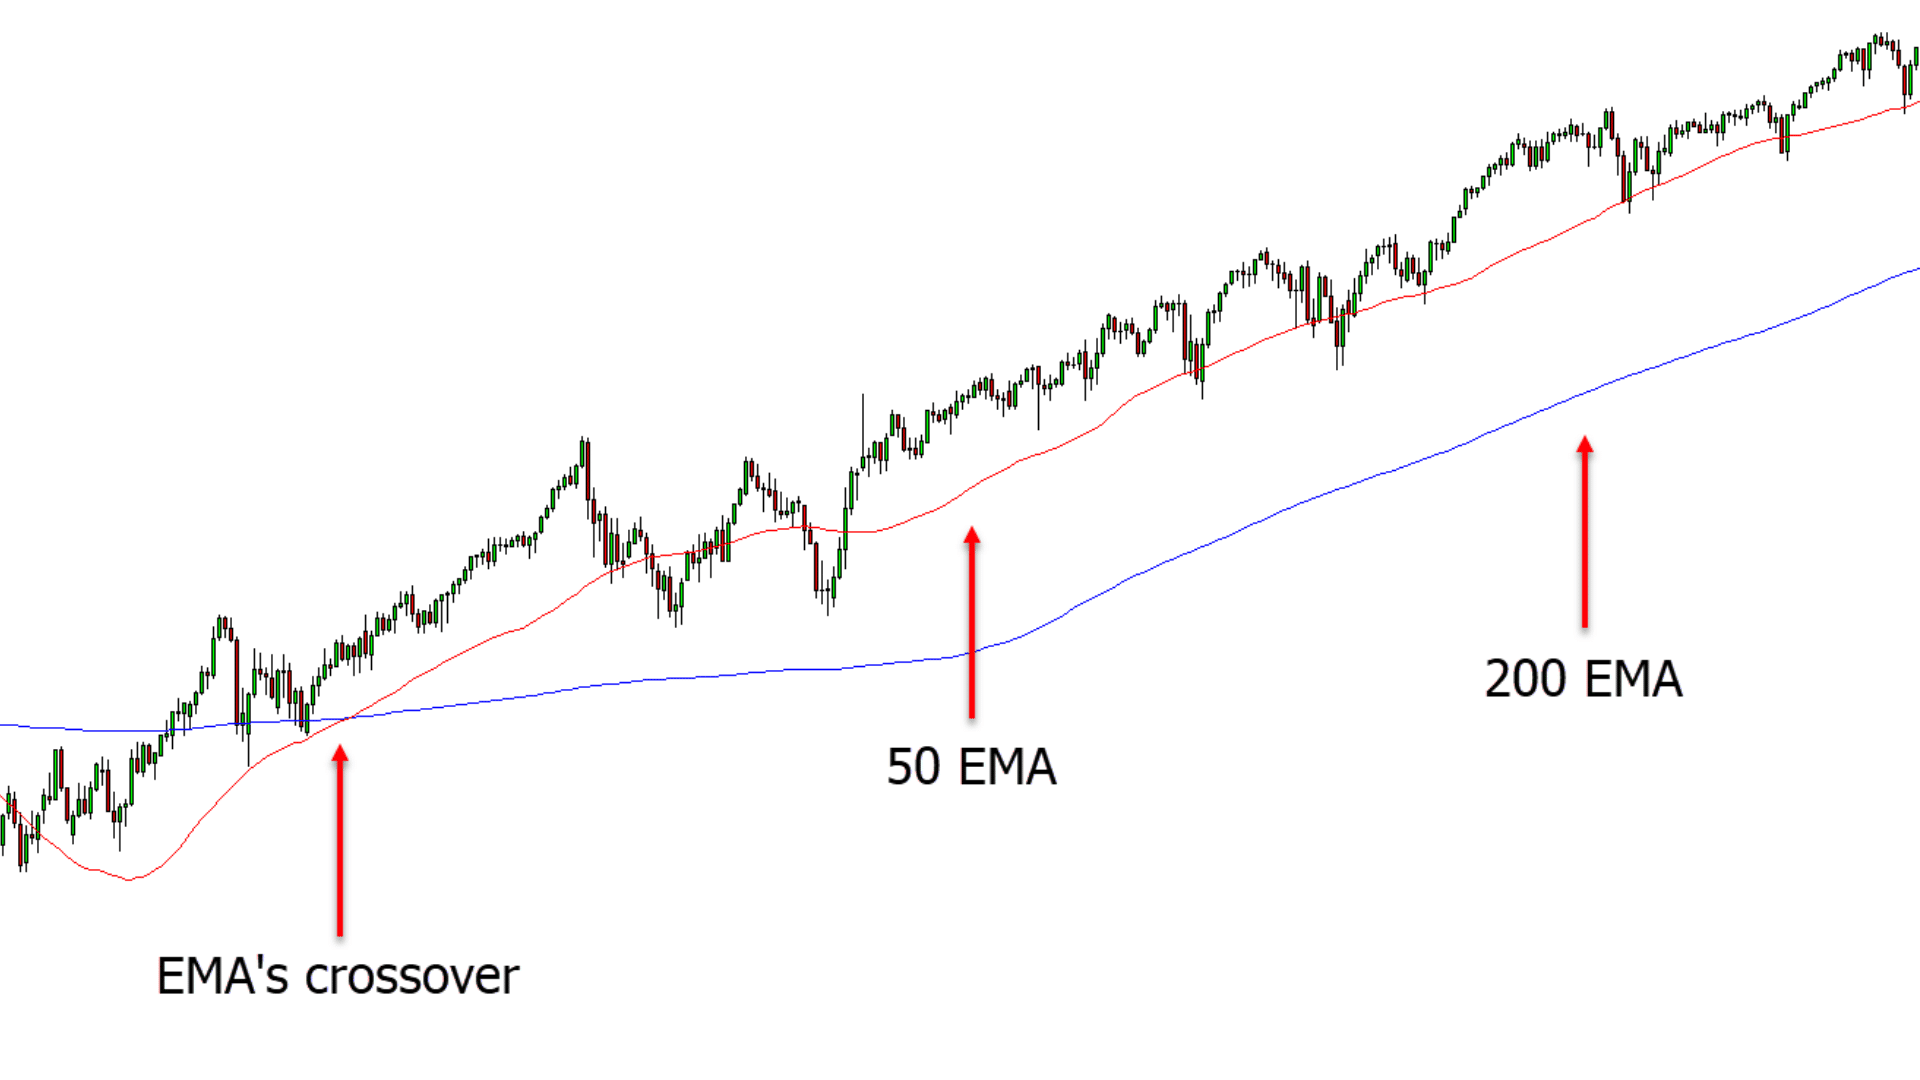
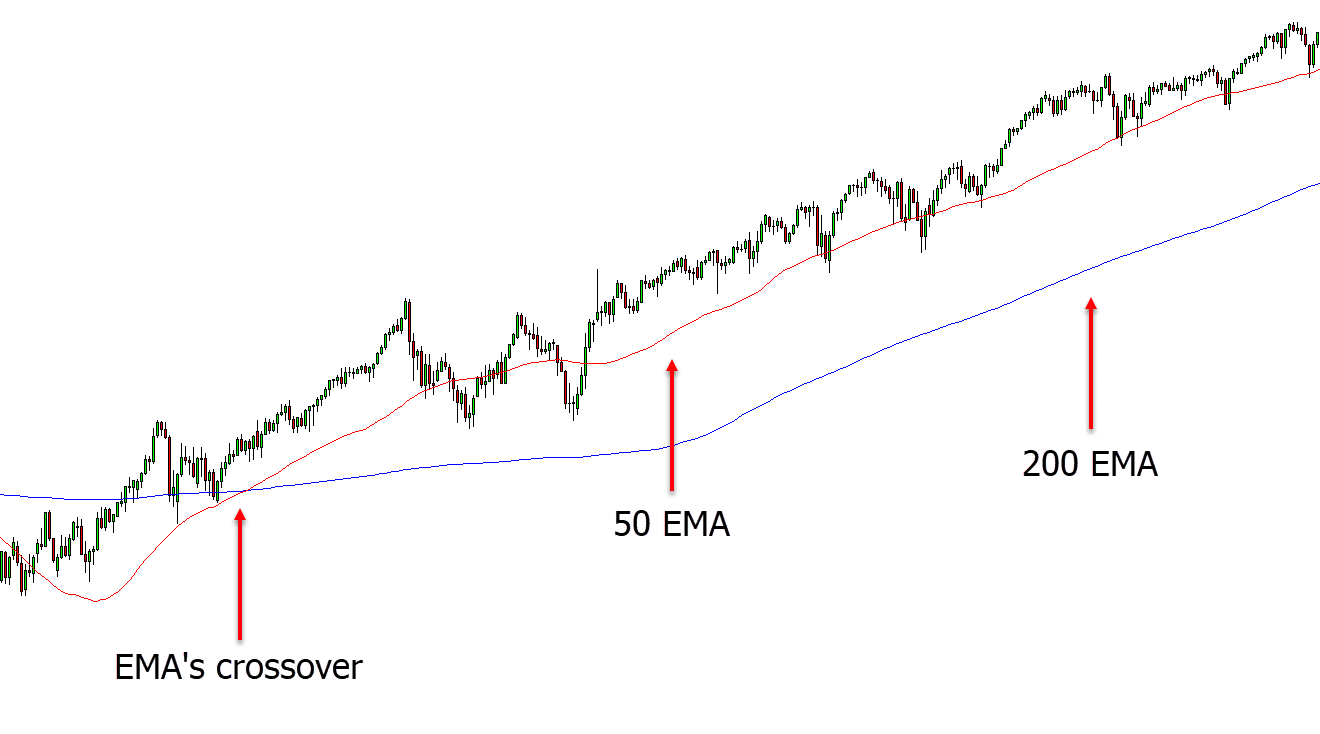
If you are interested in trend trading, the 50-day, 100-day, and 200-day moving averages will be the most relevant indicators you use to inform your trading.
Moving average crossovers are also one way in which you can use these moving averages to predict price movements.
You can plot the 50-day and 200-day moving averages into your chart. If the 50-day moving average crosses above the 200-day moving average, you can consider this a signal to buy as it is likely the price will begin to trend upward.
If the 50-day moving average drops below the 200-day, this indicates that the price will soon begin to fall, so you should consider closing your position at this point.
MACD
The Moving average crossovers (MACD) is a type of oscillating indicator that moves above and below 0.
A common trading strategy using the MACD is to examine whether the lines are above or below 0. If the MACD lines are above 0 for a sustained period of time, then the security will likely be trending upwards. The opposite is also true if the MACD lines are below 0 for a sustained period of time.
RSI – Relative Strength Index
Finally, we have the Relative Strength Index (RSI). This is another type of oscillating indicator. Unlike the MACD, the RSI does not move above and below 0 but is contained between 0 – 100. The RSI can be used to inform traders when a security is either overbought or oversold.
Generally speaking, if the RSI is above 70, the security can be considered overbought and due for a correction. If the RSI is below 30, then it can be considered oversold and due for a rise.
It is important to consider the wider context of a security’s trend before deciding whether a security is overbought or oversold. The primary trend is an important factor to consider when attempting to interpret the Relative Strength Index properly.
For example, an oversold reading on the RSI of a stock trending upwards is likely much higher than 30%, and an overbought reading on the RSI of a stock that is experiencing a downtrend is likely to be significantly lower than 70%.
Trend Strength Indicator MT4
MetaTrader4 is an electronic trading platform with a wide array of custom indicators.
They also have a custom trend strength indicator available for you to download for free.
This indicator allows you to observe different colored bars on your chart, which indicate the strength of a trend. The trends are calculated with this indicator using moving averages.
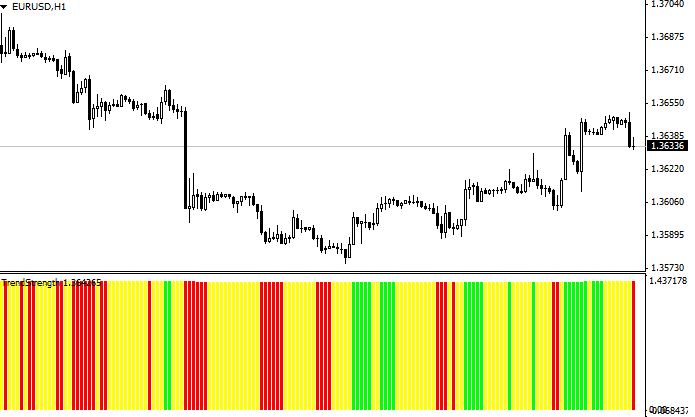
If there is an uptrend, you will see green bars. Red bars indicate a downtrend, and yellow bars indicate that the trend is weak.
You can download and read more about the MT4 trend strength indicator here.
Trend Strength Indicator MT5
MetaTrader5 is a multi-asset online platform that provides for trading in forex, stocks, and futures.
MT5 offers superior tools for comprehensive price analysis.
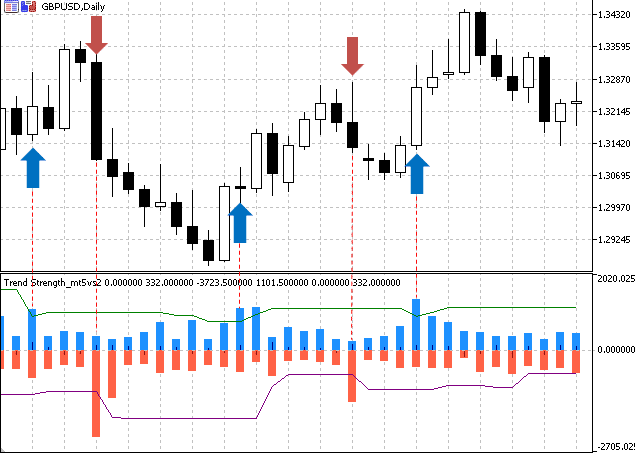
Similar to MT4, MT5 also has custom trend strength indicators available for traders to download.
This is a premium trend strength indicator that can help you both identify the trend and its strength. You can also test out a free demo of this indicator to see if it helps you.
You can download and read more about the MT5 trend strength indicator here.
Note: Don’t know how to install and use these indicators? Read How to Download, Install and Use MT4 and MT5 Indicators.
Lastly
Indicators are vital tools for every individual who wishes to trade the financial markets. They provide a wealth of valuable information that traders can base their trading decisions on.
The more reliable information you have access to, the higher the probability of successfully trading the markets.
It would be best to never rely on a single indicator or data point to make a trade. It is considered best practice to always verify your conclusions by comparing them against other indicators and data points to see if they support your trade thesis.
