Have you ever noticed that even in the strongest of trends price will always make rotations? This is known as mean reversion or price reverting back to the mean.
In this trading guide we look at exactly what mean reversion trading is and how you can use it to find high probability trades.
NOTE: Get your Mean Reversion Trading Strategy PDF Download Below.
Table of Contents
What is Mean Reversion Trading?
When mean reversion trading you are making trades on the assumption that price will revert to the ‘mean’.
Price never moves higher or lower in a straight line.
Even in the very strongest of trends either higher or lower price will make rotations. For example; in a strong trend higher price will still make rotations lower before then continuing with the trend higher.
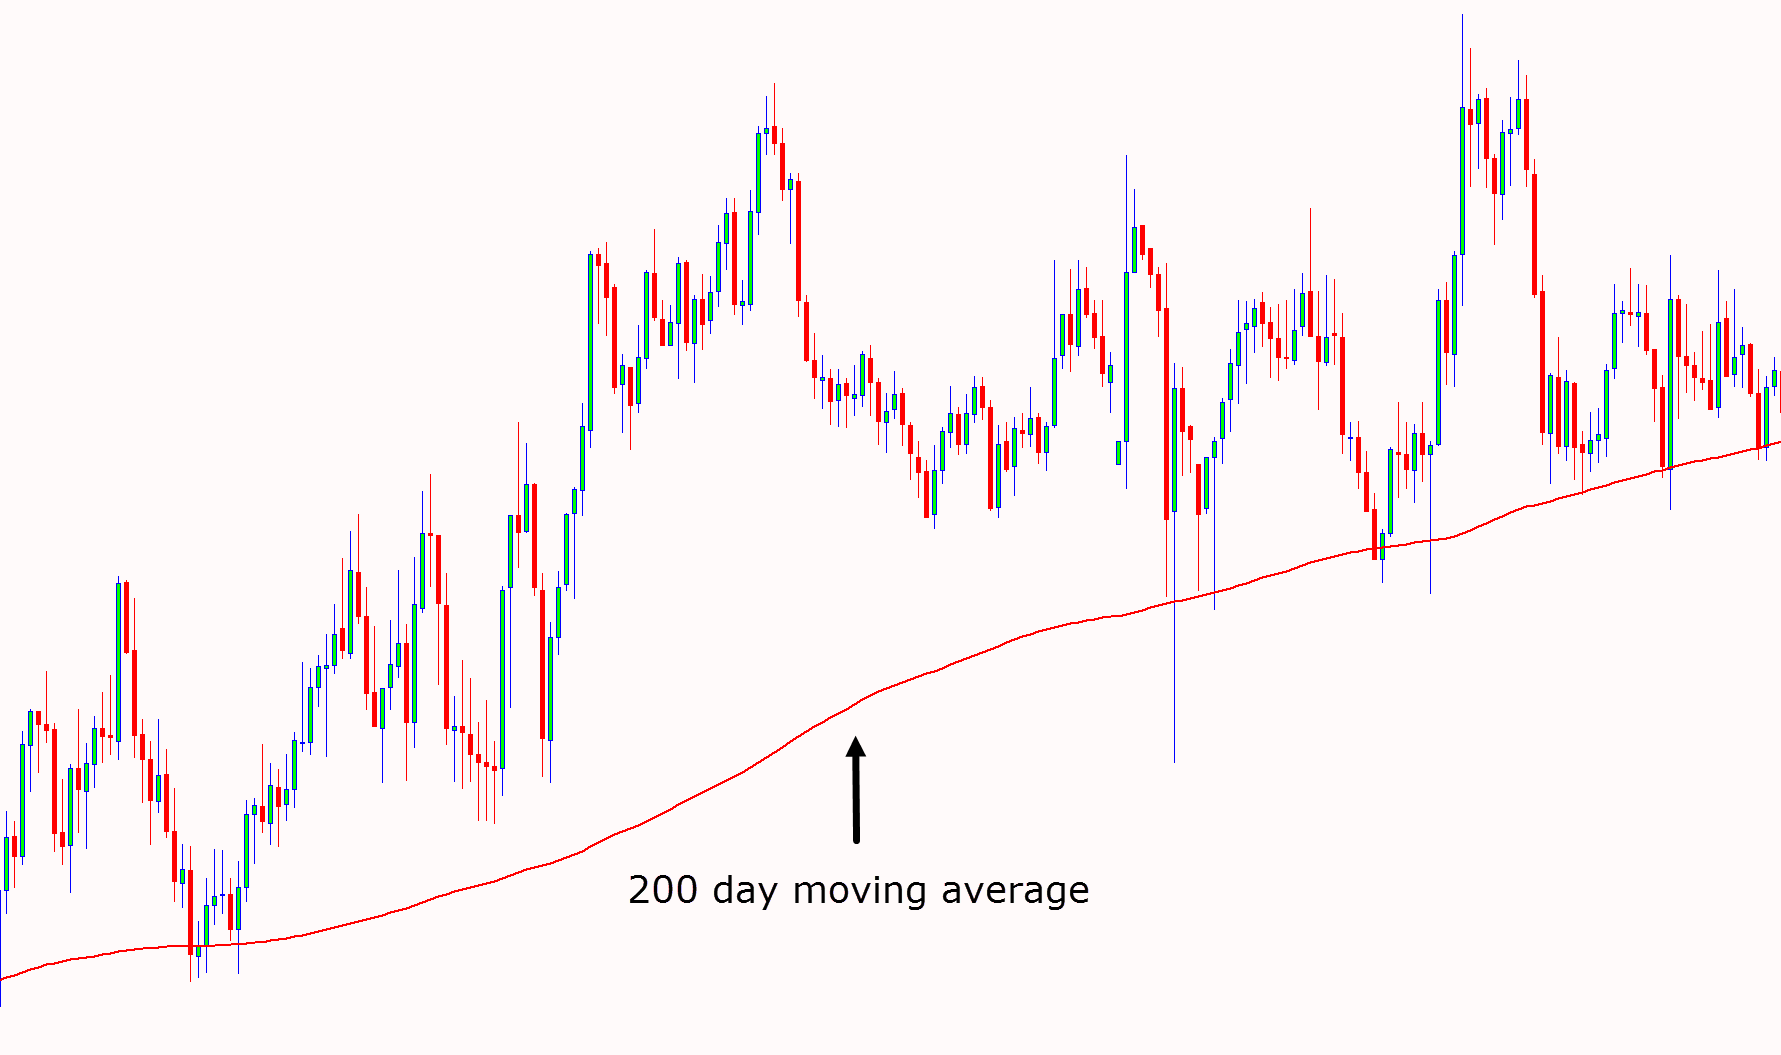
In the example below price is in a strong trend higher. Attached to the chart is a 200 period moving average. Even as price continually moves higher it is still rotating back lower before then making the next leg higher.
Mean Reversion Trading vs Momentum Trading
As a momentum trader you are looking for price to continue in the same direction. For example; if price is in a trend higher you are looking to make a long trade and for price to continue with the trend.
There are many different strategies you may use to momentum trade, but you are looking for price to continue with the current momentum.
When mean reversion trading you are looking for price to revert back to the mean. This means that if price has made an extended leg higher you would be looking for a rotation back lower and a pullback into value.
Mean Reversion Trading in the Forex Market
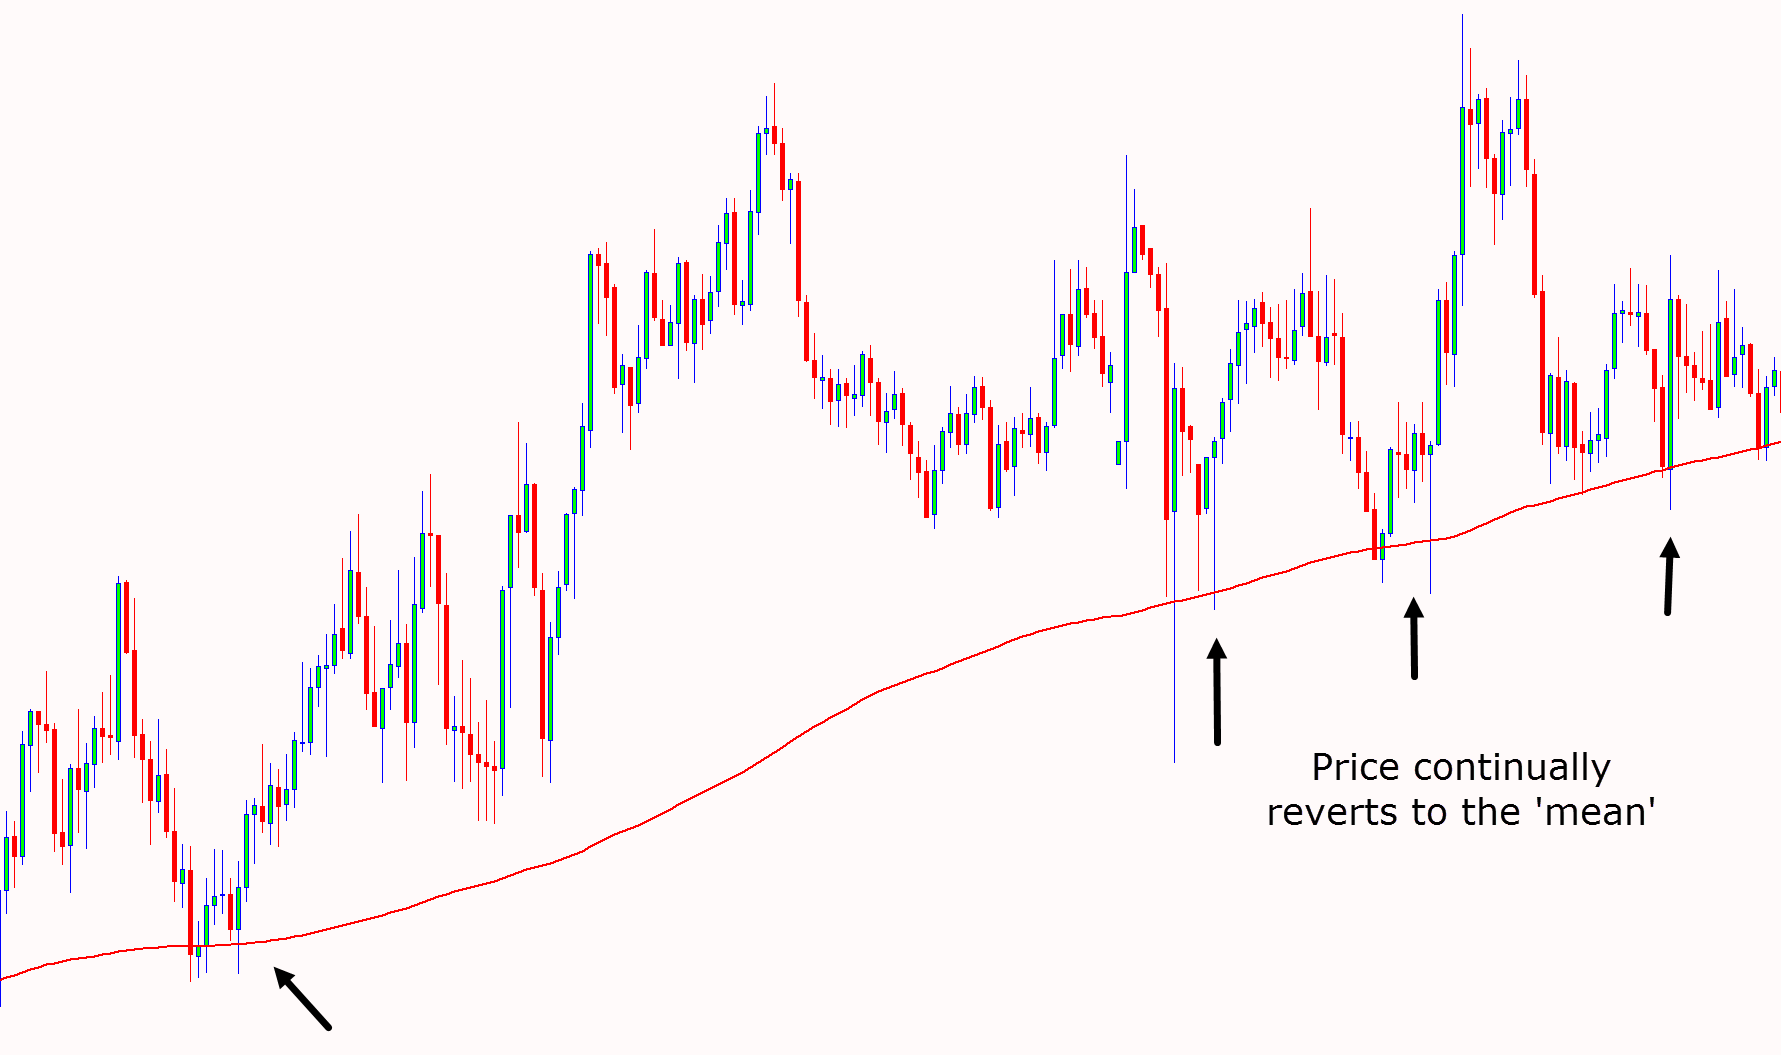
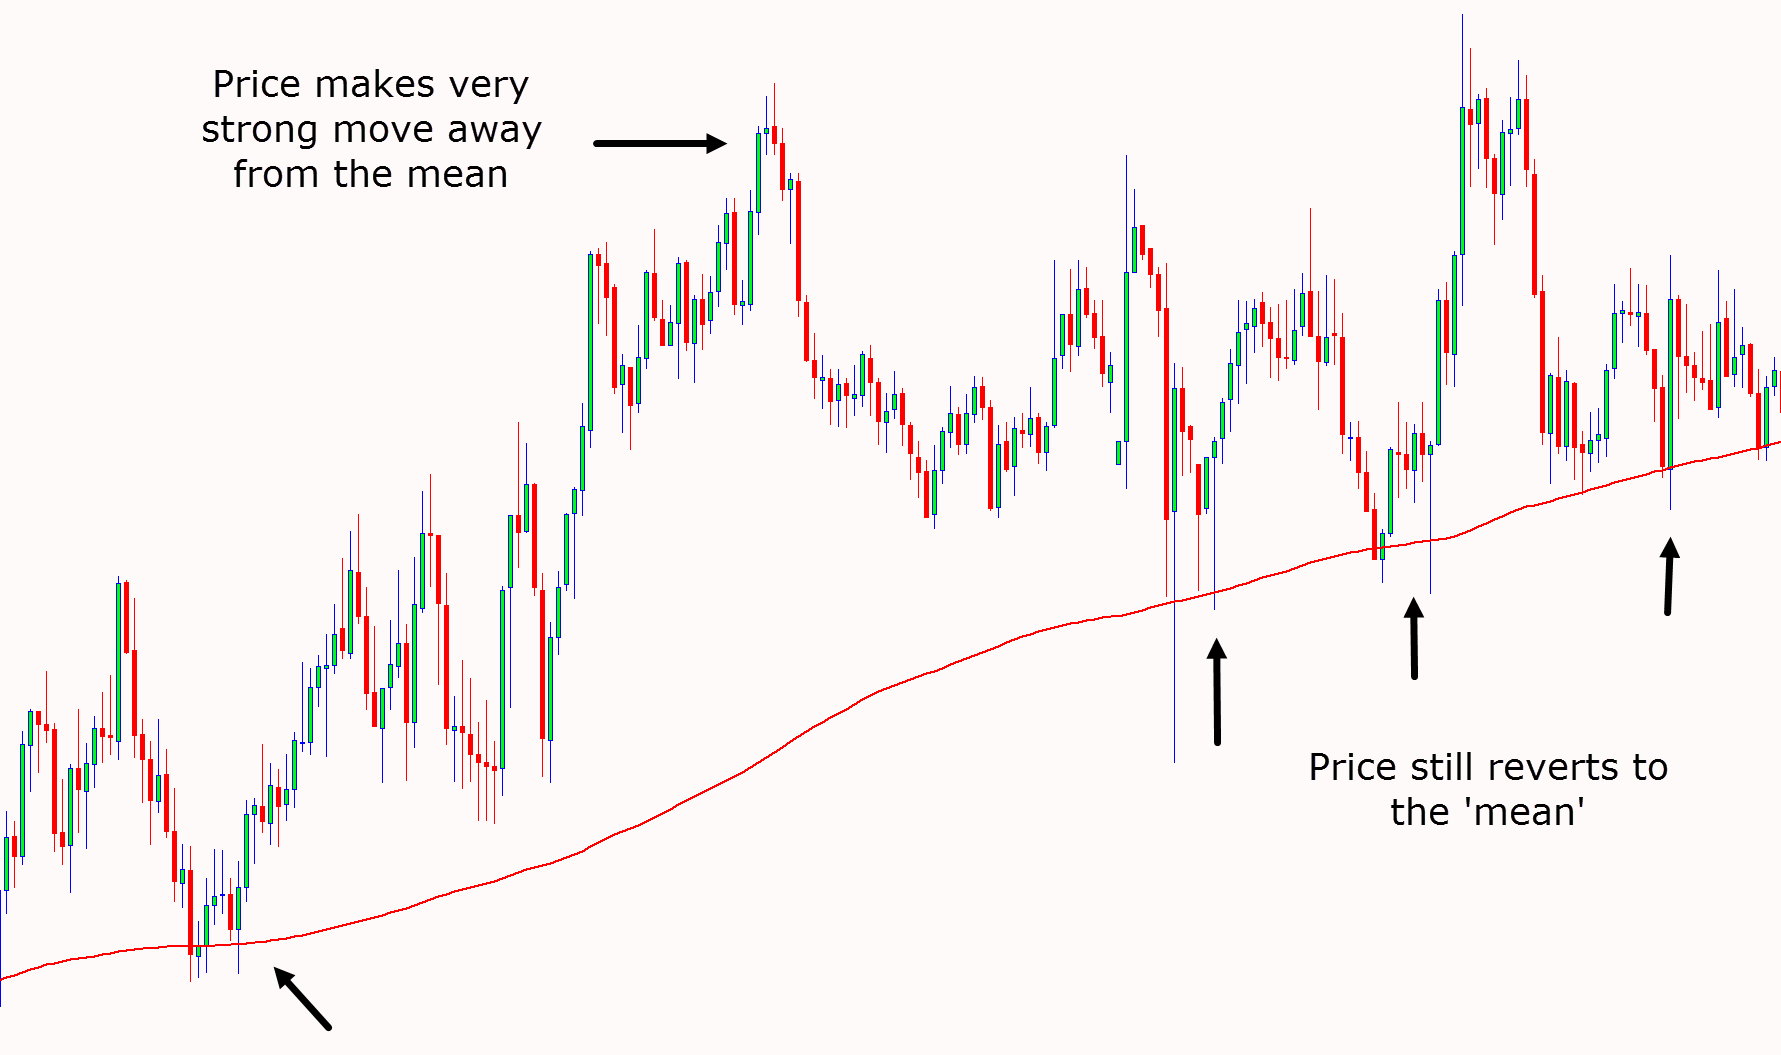
One of the most popular markets to use mean reversion strategies is in the Forex market. This is because Forex pairs can often make very large moves that will see regular rotations back towards the mean.
The chart example below shows price continually moving back lower and into the mean level of the moving average even after some incredibly powerful moves higher.
Mean reversion trading will often be higher risk because you will be making trades against the current momentum.
You will often be looking to pick a market top or bottom and you will also be looking for price to reverse its current direction.
The Best Mean Reversion Indicator
One of the simplest and easiest indicators to use for mean reversion trading is the exponential moving average.
When you combine two moving averages and look for the ‘cross’ you can begin to look for very simple and high probability mean reversion trading setups.
Keep in mind when using the moving average cross you are not looking to trade with the momentum, but instead are looking for a rotation back into the mean. This strategy is discussed more below.
You can read about how to use the moving average crossover here.
Basic Mean Reversion Strategy
Whilst a lot of traders use moving average crossovers to find trend and momentum trades, they can also be used to find mean reversion trades.
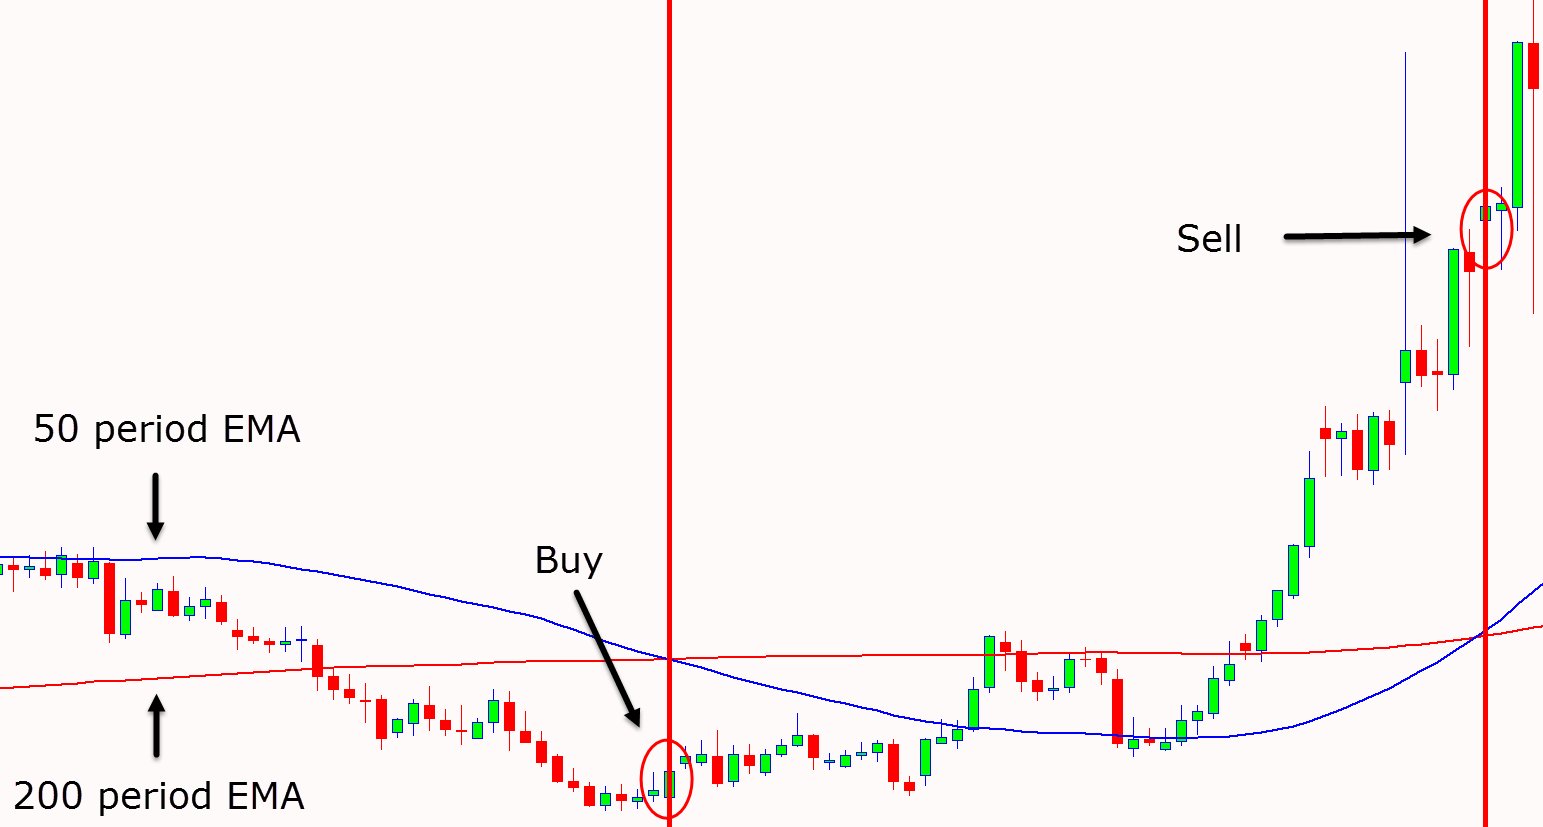
The easiest way to do this is to use the 200 and 50 period moving average.
As the chart shows below; when the 50 period moving average crosses below the 200 period moving average we are looking to take long trades.
When the 50 period moving average crosses back above the 200 period moving average we are looking to take profit.
This strategy can be added to further by making sure you don’t trade directly into key market support or resistance levels and that you avoid markets that are very choppy or sideways.
The best markets are the markets making strong moves either higher or lower and that are not stuck in ranges.
Short-Term Intraday Mean Reversion Strategy
This is a higher risk mean reversion trading strategy that comes with higher potential rewards.
With this short-term intraday strategy you are using small time frames like the 5 minute and 15 minute time frame.
The key is finding markets or Forex pairs that have made a strong trend or move higher or lower.
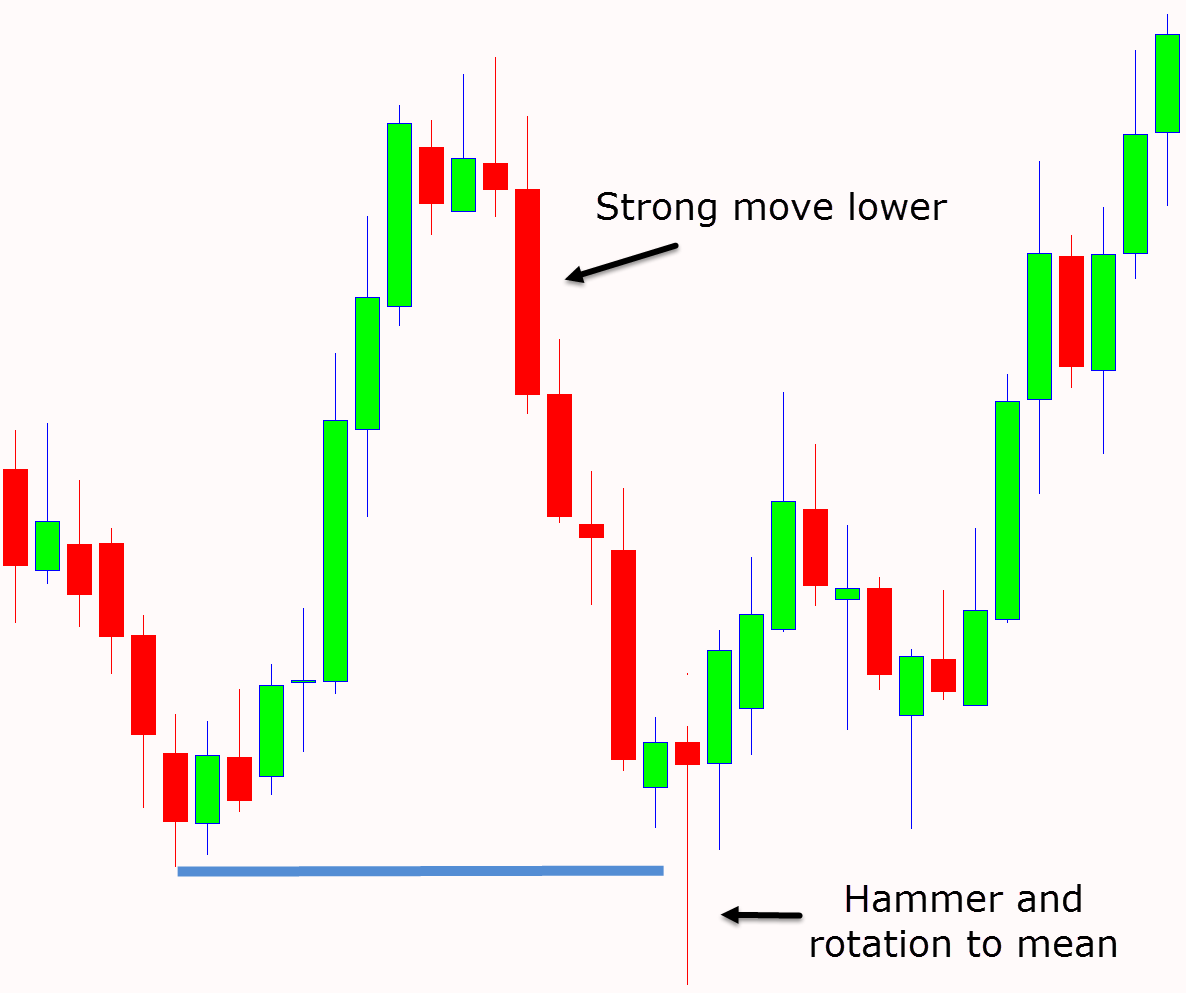
Once you have found a market that has made this large move you are looking to use a simple Japanese reversal candlestick patterns such as the hammer candlestick pattern to time your entry and make quick profits as price reverts to the mean.
As the example shows below; price made a large move lower before forming the hammer candlestick. Price then moves back higher and rotates back into the mean.
Note how this hammer is formed at a support level. You can increase the odds of your trades with this trading strategy by making your trades at key market levels.